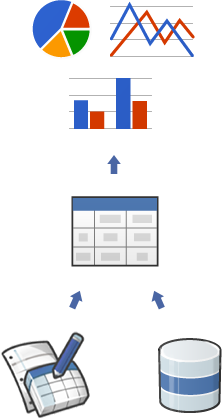
Google グラフを使用すると、ウェブサイト上のデータを可視化できます。 グラフ ギャラリーには、シンプルな折れ線グラフから複雑な階層ツリーマップまで、すぐに使用できる多数のグラフタイプが用意されています。
Google Chart を使用する最も一般的な方法は、ウェブページに埋め込む簡単な JavaScript を使用する方法です。いくつかの Google Chart ライブラリを読み込み、グラフ化するデータをリストして、グラフをカスタマイズするオプションを選択し、最後に選択した id でグラフ オブジェクトを作成します。 次に、そのウェブページの <div> に、この id を指定して Google グラフを表示します。
スタートガイドをご覧ください。
グラフは JavaScript クラスとして公開されます。Google グラフでは、さまざまなグラフの種類を使用できます。通常はデフォルトのデザインで十分ですが、ウェブサイトの外観に合わせてグラフをカスタマイズできます。グラフは高度にインタラクティブなもので、イベントを公開することで、複雑なダッシュボードの作成や、ウェブページに統合されたウェブサイト エクスペリエンスの構築が可能になります。グラフは、HTML5/SVG 技術を使用してレンダリングされ、ブラウザ間互換性(古い IE バージョンの VML を含む)と、iPhone、iPad、Android へのクロス プラットフォーム ポータビリティを提供します。ユーザーがプラグインやソフトウェアに手を加える必要はありません。 ウェブブラウザがあればグラフを見ることができます。
すべてのグラフタイプは DataTable クラスを使用してデータが取り込まれるため、テストをする際に最適なグラフタイプを簡単に切り替えることができます。DataTable は、データの並べ替え、変更、フィルタリングを行うメソッドを提供し、ウェブページ、データベース、または Chart Tools Datasource プロトコルをサポートする任意のデータ プロバイダから直接入力できます。(このプロトコルは SQL に似たクエリ言語で、Google スプレッドシート、Google Fusion Tables、SalesForce などのサードパーティのデータ プロバイダが実装しています。独自のプロトコルを実装して、他のサービスのデータ プロバイダにすることもできます。)
最初のグラフを作成する準備はできましたか?クイックスタートをご覧ください。
Google のツールはお客様のニーズに応えるため、絶えず進化を続けています。皆様からのフィードバックは、どの機能を優先的に使用するかの判断材料となります。 ヘルプグループにご参加ください。