Библиотека источников данных визуализации Google упрощает создание источника данных визуализации. Библиотека реализует проводной протокол Google Visualization API и язык запросов. Вы пишете только код, необходимый для того, чтобы сделать ваши данные доступными для библиотеки в виде таблицы данных. Таблица данных — это двумерная таблица значений, в которой каждый столбец относится к одному типу. Написание необходимого вам кода упрощается благодаря предоставлению абстрактных классов и вспомогательных функций.
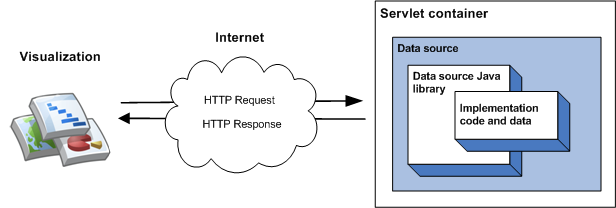
Простейшая реализация библиотеки включает в себя наследование от одного класса, реализацию функции-члена и запуск источника данных как сервлета в контейнере сервлетов. В простейшей реализации следующая последовательность событий происходит, когда визуализация запрашивает источник данных:
Контейнер сервлета обрабатывает запрос и передает его в библиотеку Java источника данных.
Библиотека анализирует запрос.
Код реализации — код, который вы пишете — возвращает таблицу данных в библиотеку.
Библиотека выполняет запрос к таблице данных.
Библиотека преобразует таблицу данных в ответ, ожидаемый визуализацией.
Контейнер сервлета возвращает ответ на визуализацию.
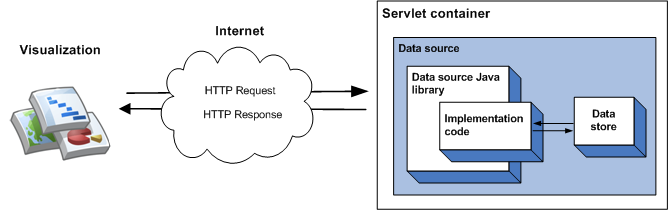
Данные, обслуживаемые источником данных, можно указать в коде реализации, что хорошо для небольших объемов статических данных. Для больших наборов данных, скорее всего, вам потребуется использовать внешнее хранилище данных, например, внешний файл или базу данных. Если источник данных использует внешнее хранилище данных, когда визуализация запрашивает источник данных, происходит следующая последовательность событий:
Контейнер сервлета обрабатывает запрос и передает его в библиотеку Java источника данных.
Библиотека анализирует запрос.
Код реализации — код, который вы пишете, — считывает данные, хранящиеся в хранилище данных, и возвращает таблицу данных в библиотеку. Если набор данных большой, а хранилище данных имеет возможности запросов, вы можете дополнительно использовать эти возможности для повышения эффективности вашего источника данных.
Библиотека выполняет запрос к таблице данных.
Библиотека преобразует таблицу данных в ответ, ожидаемый визуализацией.
Контейнер сервлета возвращает ответ на визуализацию.
[[["Прост для понимания","easyToUnderstand","thumb-up"],["Помог мне решить мою проблему","solvedMyProblem","thumb-up"],["Другое","otherUp","thumb-up"]],[["Отсутствует нужная мне информация","missingTheInformationINeed","thumb-down"],["Слишком сложен/слишком много шагов","tooComplicatedTooManySteps","thumb-down"],["Устарел","outOfDate","thumb-down"],["Проблема с переводом текста","translationIssue","thumb-down"],["Проблемы образцов/кода","samplesCodeIssue","thumb-down"],["Другое","otherDown","thumb-down"]],["Последнее обновление: 2024-07-10 UTC."],[[["\u003cp\u003eThe Google Visualization Data Source Library simplifies the creation of visualization data sources by implementing the Google Visualization API wire protocol and query language.\u003c/p\u003e\n"],["\u003cp\u003eDevelopers primarily need to write code to make their data available as a data table, leveraging the library's abstract classes and helper functions.\u003c/p\u003e\n"],["\u003cp\u003eData sources can be implemented as servlets, handling queries from visualizations and returning data tables for rendering.\u003c/p\u003e\n"],["\u003cp\u003eFor larger datasets, the library supports using external data stores like files or databases, enabling efficient querying capabilities.\u003c/p\u003e\n"],["\u003cp\u003eThe library handles query parsing, data table execution, and rendering into the response format expected by the visualization.\u003c/p\u003e\n"]]],[],null,["# Introduction to the Data Source Library\n\n[Visit\nthe library project page!](http://code.google.com/p/google-visualization-java/)\n\nThe Google Visualization Data Source Library makes\nit easy to create a visualization data source. The library implements\nthe Google Visualization API wire\nprotocol and query language. You write only the code that is required to\nmake your data available to the library in the form of a data\ntable. A data table is a two-dimensional table of values where every\ncolumn is of a single type. Writing the code that you need is made easier\nby the provision of abstract classes and helper functions.\n\nThe simplest implementation of the library involves inheriting from\na single class, implementing a member function and running the\ndata source as a servlet within a servlet container. In the simplest\nimplementation, the following sequence of events takes place\nwhen a visualization queries the data source:\n\n1. The servlet container handles the query and passes it to the data source Java library.\n2. The library parses the query.\n3. The implementation code - the code that you write - returns a data table to the library.\n4. The library executes the query on the data table.\n5. The library renders the data table into the response expected by the visualization.\n6. The servlet container returns the response to the visualization.\n\nThis is illustrated in the following diagram:\n\nThe [Getting Started with Data Sources](/chart/interactive/docs/dev/dsl_get_started) section describes\nhow to implement this type of data source.\n\nThe data\nthat is served by a data source can be specified in your implementation\ncode, which is fine for small amounts of static data. For larger\ndata sets it is more likely you will need to use an external data store\nsuch as an external file or database. If a data source uses an external\ndata store, the following sequence of events takes place when a visualization\nqueries the data source:\n\n1. The servlet container handles the query and passes it to the data source Java library.\n2. The library parses the query.\n3. The implementation code - the code you write - reads the data held in the data store and returns a data table to the library. If the data set is large, and the data store has querying [capabilities](/chart/interactive/docs/dev/dsl_key_concepts#capabilities), you can optionally use those capabilities to increase the efficiency of your data source.\n4. The library executes the query on the data table.\n5. The library renders the data table into the response expected by the visualization.\n6. The servlet container returns the response to the visualization.\n\nThis is illustrated in the following diagram:\n\nThe [Using an External Data Store](/chart/interactive/docs/dev/dsl_csv) section describes how to implement this\ntype of data source."]]