Biblioteka źródeł danych wizualizacji Google ułatwia utworzenie źródła danych wizualizacji. Biblioteka implementuje protokół przewodowy interfejsu API wizualizacji Google oraz język zapytania. Wpisujesz tylko kod, który jest wymagany do udostępnienia danych bibliotece w formie tabeli danych. Tabela danych to dwuwymiarowa tabela wartości, w których każda kolumna ma 1 typ. Kod, którego potrzebujesz, jest łatwiejszy do pisania – możesz używać abstrakcyjnych klas i funkcji pomocniczych.
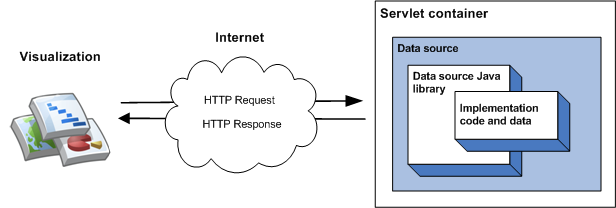
Najprostsza implementacja biblioteki obejmuje dziedziczenie z jednej klasy, zaimplementowanie funkcji użytkownika i uruchomienie źródła danych jako serwletu w kontenerze serwletu. W najprostszej implementacji wizualizacja źródła danych ma miejsce w ramach tej sekwencji zdarzeń:
Kontener serwletu obsługuje zapytanie i przekazuje je do biblioteki Java źródła danych.
Biblioteka analizuje zapytanie.
Kod implementacji, który napiszesz, zwraca tabelę do biblioteki.
Biblioteka wykonuje zapytanie w tabeli danych.
Biblioteka renderuje tabelę danych na odpowiedź oczekiwaną przez wizualizację.
Kontener serwletu zwraca odpowiedź na wizualizację.
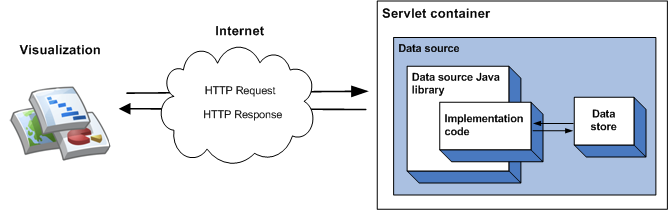
Dane dostarczane przez źródło danych można podać w kodzie implementacji, co sprawdza się w przypadku małych ilości danych statycznych. W przypadku większych zbiorów danych konieczne może być użycie zewnętrznego magazynu danych, takiego jak zewnętrzny plik lub baza danych. Jeśli źródło danych korzysta z zewnętrznego magazynu danych, podczas wizualizacji źródła danych wykonywane jest ta sekwencja zdarzeń:
Kontener serwletu obsługuje zapytanie i przekazuje je do biblioteki Java źródła danych.
Biblioteka analizuje zapytanie.
Kod implementacji, czyli kod, który wpiszesz, odczytuje dane przechowywane w magazynie danych i zwraca tabelę danych do biblioteki. Jeśli zbiór danych jest duży, a magazyn danych ma możliwości wysyłania zapytań, możesz opcjonalnie użyć tych funkcji, by zwiększyć wydajność źródła danych.
Biblioteka wykonuje zapytanie w tabeli danych.
Biblioteka renderuje tabelę danych na odpowiedź oczekiwaną przez wizualizację.
Kontener serwletu zwraca odpowiedź na wizualizację.
[[["Łatwo zrozumieć","easyToUnderstand","thumb-up"],["Rozwiązało to mój problem","solvedMyProblem","thumb-up"],["Inne","otherUp","thumb-up"]],[["Brak potrzebnych mi informacji","missingTheInformationINeed","thumb-down"],["Zbyt skomplikowane / zbyt wiele czynności do wykonania","tooComplicatedTooManySteps","thumb-down"],["Nieaktualne treści","outOfDate","thumb-down"],["Problem z tłumaczeniem","translationIssue","thumb-down"],["Problem z przykładami/kodem","samplesCodeIssue","thumb-down"],["Inne","otherDown","thumb-down"]],["Ostatnia aktualizacja: 2024-07-10 UTC."],[[["\u003cp\u003eThe Google Visualization Data Source Library simplifies the creation of visualization data sources by implementing the Google Visualization API wire protocol and query language.\u003c/p\u003e\n"],["\u003cp\u003eDevelopers primarily need to write code to make their data available as a data table, leveraging the library's abstract classes and helper functions.\u003c/p\u003e\n"],["\u003cp\u003eData sources can be implemented as servlets, handling queries from visualizations and returning data tables for rendering.\u003c/p\u003e\n"],["\u003cp\u003eFor larger datasets, the library supports using external data stores like files or databases, enabling efficient querying capabilities.\u003c/p\u003e\n"],["\u003cp\u003eThe library handles query parsing, data table execution, and rendering into the response format expected by the visualization.\u003c/p\u003e\n"]]],[],null,["# Introduction to the Data Source Library\n\n[Visit\nthe library project page!](http://code.google.com/p/google-visualization-java/)\n\nThe Google Visualization Data Source Library makes\nit easy to create a visualization data source. The library implements\nthe Google Visualization API wire\nprotocol and query language. You write only the code that is required to\nmake your data available to the library in the form of a data\ntable. A data table is a two-dimensional table of values where every\ncolumn is of a single type. Writing the code that you need is made easier\nby the provision of abstract classes and helper functions.\n\nThe simplest implementation of the library involves inheriting from\na single class, implementing a member function and running the\ndata source as a servlet within a servlet container. In the simplest\nimplementation, the following sequence of events takes place\nwhen a visualization queries the data source:\n\n1. The servlet container handles the query and passes it to the data source Java library.\n2. The library parses the query.\n3. The implementation code - the code that you write - returns a data table to the library.\n4. The library executes the query on the data table.\n5. The library renders the data table into the response expected by the visualization.\n6. The servlet container returns the response to the visualization.\n\nThis is illustrated in the following diagram:\n\nThe [Getting Started with Data Sources](/chart/interactive/docs/dev/dsl_get_started) section describes\nhow to implement this type of data source.\n\nThe data\nthat is served by a data source can be specified in your implementation\ncode, which is fine for small amounts of static data. For larger\ndata sets it is more likely you will need to use an external data store\nsuch as an external file or database. If a data source uses an external\ndata store, the following sequence of events takes place when a visualization\nqueries the data source:\n\n1. The servlet container handles the query and passes it to the data source Java library.\n2. The library parses the query.\n3. The implementation code - the code you write - reads the data held in the data store and returns a data table to the library. If the data set is large, and the data store has querying [capabilities](/chart/interactive/docs/dev/dsl_key_concepts#capabilities), you can optionally use those capabilities to increase the efficiency of your data source.\n4. The library executes the query on the data table.\n5. The library renders the data table into the response expected by the visualization.\n6. The servlet container returns the response to the visualization.\n\nThis is illustrated in the following diagram:\n\nThe [Using an External Data Store](/chart/interactive/docs/dev/dsl_csv) section describes how to implement this\ntype of data source."]]