 Google uses AI technology to translate content into your preferred language. AI translations can contain errors.
資料來源程式庫簡介
透過集合功能整理內容
你可以依據偏好儲存及分類內容。
Google 視覺化資料來源程式庫可讓您輕鬆建立視覺化資料來源。程式庫會實作 Google 視覺化 API 傳輸通訊協定和查詢語言。您只需編寫資料形式的程式碼,即可將資料提供給程式庫。資料表是二維資料表,每個資料欄都屬於單一類型。提供抽象類別和輔助函式,讓您更輕鬆地編寫所需的程式碼。
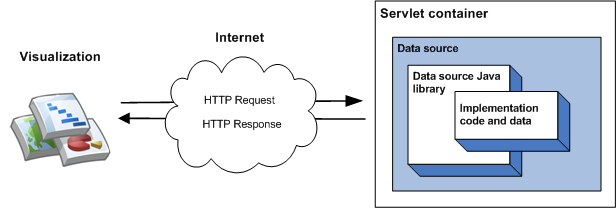
最簡單的程式庫實作方式是沿用單一類別、實作成員函式,以及將資料來源做為 Webhook 容器中的 bq 執行。在最簡單的導入方式中,視覺化查詢查詢資料來源時會依序發生以下事件:
- bq 容器會處理查詢,並將查詢傳送至資料來源 Java 程式庫。
- 程式庫會剖析查詢。
- 實作程式碼 (您編寫的程式碼) 會將資料表傳回程式庫。
- 程式庫會在資料表上執行查詢。
- 程式庫會將資料表轉譯為視覺化呈現預期的回應。
- bq 容器會傳回視覺化圖表的回應。
如下圖所示:
「開始使用資料來源」一節說明如何實作這類資料來源。
您可以在實作程式碼中指定由資料來源提供的資料,適用於少量靜態資料。資料集越大,您需要使用外部資料儲存庫 (例如外部檔案或資料庫)。如果資料來源使用外部資料儲存庫,則視覺化圖表查詢資料來源時,會發生以下事件順序:
- bq 容器會處理查詢,並將查詢傳送至資料來源 Java 程式庫。
- 程式庫會剖析查詢。
- 實作程式碼 (您編寫的程式碼) 會讀取儲存在資料儲存庫中的資料,並將資料表格傳回程式庫。如果資料集較大,且資料儲存庫有查詢功能,則可以選擇使用這些功能提高資料來源的效率。
- 程式庫會在資料表上執行查詢。
- 程式庫會將資料表轉譯為視覺化呈現預期的回應。
- bq 容器會傳回視覺化圖表的回應。
如下圖所示:

如要瞭解如何使用這類資料來源,請參閱使用外部資料儲存庫一節。
除非另有註明,否則本頁面中的內容是採用創用 CC 姓名標示 4.0 授權,程式碼範例則為阿帕契 2.0 授權。詳情請參閱《Google Developers 網站政策》。Java 是 Oracle 和/或其關聯企業的註冊商標。
上次更新時間:2024-07-10 (世界標準時間)。
[[["容易理解","easyToUnderstand","thumb-up"],["確實解決了我的問題","solvedMyProblem","thumb-up"],["其他","otherUp","thumb-up"]],[["缺少我需要的資訊","missingTheInformationINeed","thumb-down"],["過於複雜/步驟過多","tooComplicatedTooManySteps","thumb-down"],["過時","outOfDate","thumb-down"],["翻譯問題","translationIssue","thumb-down"],["示例/程式碼問題","samplesCodeIssue","thumb-down"],["其他","otherDown","thumb-down"]],["上次更新時間:2024-07-10 (世界標準時間)。"],[],[]]