總覽
十字線的垂直和水平線,以圖表資料點為中心。如果做為圖表建立者,在圖表中啟用交叉線,使用者就可以指定單一元素:
可選擇的十字瞄準線、所選內容,或同時顯示兩者。這些圖表適用於散佈圖、折線圖、面積圖,以及組合圖的折線與面積圖。
簡易範例
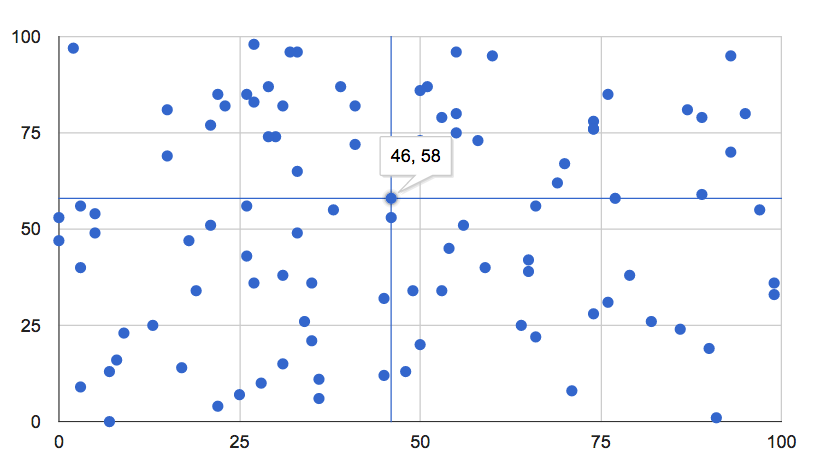
將滑鼠遊標懸停在下列點上,或是選取這些點,即可查看十字瞄準線:
以下是建立上方圖表的完整網頁,十字線以粗體顯示:
<html>
  <head>
    <script type="text/javascript" src="https://www.gstatic.com/charts/loader.js"></script>
    <script type="text/javascript">
      google.charts.load("current", {packages:["corechart"]});
      google.charts.setOnLoadCallback(drawChart);
      function drawChart() {
        var data = new google.visualization.DataTable();
        data.addColumn('number');
        data.addColumn('number');
        for (var i = 0; i < 100; i++)
          data.addRow([Math.floor(Math.random()*100),
                       Math.floor(Math.random()*100)]);
        var options = {
          legend: 'none',
          crosshair: { trigger: 'both' } // Display crosshairs on focus and selection.
        };
        var chart = new google.visualization.ScatterChart(document.getElementById('chart_div'));
        chart.draw(data, options);
      }
    </script>
  </head>
  <body>
    <div id="chart_div" style="width: 900px; height: 500px;"></div>
  </body>
</html>
十字瞄準線選項
可用的十字瞄準線選項如下:
crosshair: { trigger: 'both' } | 在焦點和選取範圍中顯示 |
crosshair: { trigger: 'focus' } | 僅顯示在焦點所在螢幕 |
crosshair: { trigger: 'selection' } | 僅在所選項目上顯示 |
crosshair: { orientation: 'both' } | 同時顯示水平和垂直髮 |
crosshair: { orientation: 'horizontal' } | 只顯示水平頭髮 |
crosshair: { orientation: 'vertical' } | 僅顯示垂直髮 |
crosshair: { color: color_string } | 將十字瞄準線顏色設為 color_string,例如'red' 或 '#f00' |
crosshair: { opacity: opacity_number } | 將十字線不透明度設為 opacity_number,其中 0.0 為完全透明,1.0 完全不透明 |
crosshair: { focused: { color: color_string } } | 將十字瞄準線顏色設為color_string。 |
crosshair: { focused: { opacity: opacity_number } } | 將十字線不透明度設為 opacity_number |
crosshair: { selected: { color: color_string } } | 在選取時將十字線顏色設為 color_string |
crosshair: { selected: { opacity: opacity_number } } | 在選取時將十字線不透明度設為 opacity_number |