
借助 Google Analytics Data API v1,您可以生成数据透视表。数据透视表是一种数据汇总工具,可通过透视(旋转)一个或多个维度的数据来重新排列表格中的信息,从而直观呈现数据。
例如,假设有以下原始数据表:
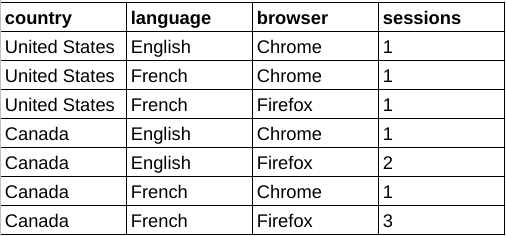
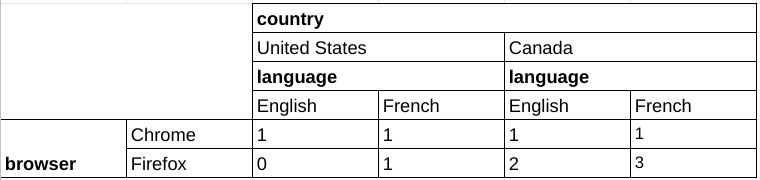
利用这些数据,您可以构建一个数据透视表,按浏览器细分会话数据,并选择国家/地区和语言维度作为额外的数据透视。
与核心报告共享的功能
对于许多共享功能,透视报告请求与核心报告请求具有相同的语义。例如,分页、维度过滤条件和用户属性在透视报告中的行为与在核心报告中相同。本指南重点介绍数据透视报告功能。如需熟悉 Data API v1 的核心报告功能,请阅读报告基础知识指南以及高级使用情形指南。
透视报告方法
Data API v1 的以下报告方法支持数据透视功能:
runPivotReport:此方法会返回包含 Google Analytics 事件数据的自定义数据透视报告。每个数据透视都描述了报告响应中的可见维度列和行。
batchRunPivotReports:此方法是
runPivotReport方法的批处理版本,允许使用单个 API 调用生成多个报告。
选择报告实体
Data API v1 的所有方法都需要在网址请求路径中以 properties/GA_PROPERTY_ID 的形式指定 Google Analytics 媒体资源标识符,例如:
POST https://analyticsdata.googleapis.com/v1beta/properties/GA_PROPERTY_ID:runPivotReport
生成的报告将基于指定 Google Analytics 媒体资源中收集的 Google Analytics 事件数据。
如果您使用的是 Data API 客户端库之一,则无需手动操作请求网址路径。大多数 API 客户端都会提供一个 property 参数,该参数需要 properties/GA_PROPERTY_ID 形式的字符串。如需查看有关如何使用客户端库的示例,请参阅快速入门指南。
透视报告请求
如需构建包含数据透视表的请求,请使用 runPivotReport 或 batchRunPivotReports 方法。
如需请求透视数据,您可以构建 RunPivotReportRequest 对象。我们建议您从以下请求参数着手:
- dateRanges 字段中的有效条目。
- 维度字段中至少有一个有效条目。
- metrics 字段中至少有一个有效条目。
- pivots 字段中至少有两个有效的透视条目。
以下是包含建议字段的请求示例:
HTTP
POST https://analyticsdata.googleapis.com/v1beta/properties/GA_PROPERTY_ID:runPivotReport
  {
    "dateRanges": [{ "startDate": "2020-09-01", "endDate": "2020-09-15" }],
    "dimensions": [
        { "name": "browser" },
        { "name": "country" },
        { "name": "language" }
      ],
    "metrics": [{ "name": "sessions" }],
    "pivots": [
      {
        "fieldNames": [
          "browser"
        ],
        "limit": 5
      },
      {
        "fieldNames": [
          "country"
        ],
        "limit": 250
      },
      {
        "fieldNames": [
          "language"
        ],
        "limit": 15
      }
    ]
  }
数据透视
使用请求正文的 pivot 字段中的 Pivot 对象来定义报告透视。每个 Pivot 描述了报告响应中的可见维度列和行。
只要每个数据透视的 limit 参数的乘积不超过 100,000,Data API v1 便可支持多个数据透视。
以下代码段演示了如何使用 pivots 构建按国家/地区生成的会话数报告,并按 browser 维度透视数据。请注意,该查询如何使用 orderBys 字段进行排序,以及如何使用 limit 和 offset 字段来实现分页。
    "pivots": [
      {
        "fieldNames": [
          "country"
        ],
        "limit": 250,
        "orderBys": [
          {
            "dimension": {
              "dimensionName": "country"
            }
          }
        ]
      },
      {
        "fieldNames": [
          "browser"
        ],
        "offset": 3,
        "limit": 3,
        "orderBys": [
          {
            "metric": {
              "metricName": "sessions"
            },
            "desc": true
          }
        ]
      }
    ],
    ...
维度
维度用于描述和分组网站或应用中的事件数据。例如,“city”维度表示每个事件的来源城市(“巴黎”或“纽约”)。在报告请求中,您可以指定零个或多个维度。
维度必须在请求正文的 dimensions 字段内定义。若要在报告中显示这些维度,还必须在 Pivot 对象的 fieldNames 字段中列出这些维度。如果某个维度未用于数据透视查询的任何数据透视,则将不会显示在报告中。透视表的 fieldNames 中不一定包含所有维度。维度只能用于过滤条件,而不能用于任何数据透视的 fieldNames。
以下代码段展示了如何针对具有 browser、country 和 language 透视的表格使用 dimension 和 fieldNames 字段:
    "pivots": [
      {
        "fieldNames": [
          "browser"
        ],
        "limit": 5,
        "orderBys": [
          {
            "metric": {
              "metricName": "sessions"
            },
            "desc": true
          }
        ]
      },
      {
        "fieldNames": [
          "country"
        ],
        "limit": 250,
        "orderBys": [
          {
            "dimension": {
              "dimensionName": "country"
            }
          }
        ]
      },
      {
        "fieldNames": [
          "language"
        ],
        "limit": 10
      }
    ],
指标
指标是对网站或应用事件数据的定量衡量。在报告请求中,您可以指定一个或多个指标。如需查看可在请求中指定的 API 指标名称的完整列表,请参阅 API 指标。
在透视报告请求中,指标是使用请求正文的 metrics 字段定义的,这与核心报告方法类似。
以下示例指定了会话数,以在报告中用作指标值:
    "metrics": [
      {
        "name": "sessions"
      }
    ],
指标汇总
使用 Pivot 对象的 metricAggregations 字段来计算每个透视的汇总指标值。
只有在请求中指定 metricAggregations 字段时,系统才会计算聚合值。
以下示例是一段查询代码,用于请求 browser 透视维度的总计:
"pivots": [
  {
    "fieldNames": [
      "browser"
    ],
    "limit": 10,
    "metricAggregations": [
      "TOTAL",
    ]
  },
  ...
计算出的指标在 RunPivotReportResponse 对象的 aggregates 字段中返回。对于聚合指标行,dimensionValues 字段包含特殊值 RESERVED_TOTAL、RESERVED_MAX 或 RESERVED_MIN。
  "aggregates": [
    {
      "dimensionValues": [
        {
          "value": "Chrome"
        },
        {
          "value": "RESERVED_TOTAL"
        },
        {
          "value": "RESERVED_TOTAL"
        }
      ],
      "metricValues": [
        {
          "value": "4"
        }
      ]
    },
    {
      "dimensionValues": [
        {
          "value": "Firefox"
        },
        {
          "value": "RESERVED_TOTAL"
        },
        {
          "value": "RESERVED_TOTAL"
        }
      ],
      "metricValues": [
        {
          "value": "6"
        }
      ]
    },
  ....

  }
分页
与核心报告方法类似,透视请求允许您在 Pivot 对象中指定 limit 和 offset 字段,以实现分页。
分页设置会分别应用于每个数据透视表。
每个 Pivot 对象都需要 limit 字段,以便限制报告基数。
只要每个数据透视的 limit 参数的乘积不超过 100000,Data API v1 便可支持多个数据透视。
以下代码段演示了如何使用 offset 和 limit 字段检索接下来的 5 个 language 维度,偏移量为 10:
      {
        "fieldNames": [
          "language"
        ],
        "offset": 10,
        "limit": 5
      }
过滤
与核心报告功能类似,如果您想在数据透视报告请求中进行维度过滤,则必须使用请求范围的维度过滤条件。
排序
可以使用 Pivot 对象的 orderBys 字段单独控制每个数据透视报告查询的排序行为,该字段包含一个 OrderBy 对象列表。
每个 OrderBy 都可以包含以下各项之一:
- DimensionOrderBy,按维度值对结果进行排序。
- MetricOrderBy,按指标值对结果进行排序。
- PivotOrderBy,用于数据透视查询,并按数据透视列组中的指标值对结果进行排序。
此示例展示了一个透视定义代码段,该代码段可根据 browser 维度透视报告,并按 sessions 指标以降序对结果进行排序。
      {
        "fieldNames": [
          "browser"
        ],
        "limit": 5,
        "orderBys": [
          {
            "metric": {
              "metricName": "sessions"
            },
            "desc": true
          }
        ]
      }
举报回答
数据透视报告 API 请求的数据透视报告响应主要包含标题和行。
响应标头
透视报告的标题由 PivotHeaders、DimensionHeaders 和 MetricHeaders 组成,其中列出了透视报告中的列。
例如,包含 browser、country 和 language 透视维度以及 sessions 指标的报告会生成如下标题:
{
  "pivotHeaders": [
    {
      "pivotDimensionHeaders": [
        {
          "dimensionValues": [
            {
              "value": "Chrome"
            }
          ]
        },
        {
          "dimensionValues": [
            {
              "value": "Firefox"
            }
          ]
        },
        ...

      ],
      ...
    },
    {
      "pivotDimensionHeaders": [
        {
          "dimensionValues": [
            {
              "value": "United States"
            }
          ]
        },
        {
          "dimensionValues": [
            {
              "value": "Canada"
            }
          ]
        },
        ...

      ],
      ...
    },
    {
      "pivotDimensionHeaders": [
        {
          "dimensionValues": [
            {
              "value": "English"
            }
          ]
        },
        {
          "dimensionValues": [
            {
              "value": "French"
            }
          ]
        },
        ...

      ],
      ...
    }
  ],
  "dimensionHeaders": [
    {
      "name": "browser"
    },
    {
      "name": "country"
    },
    {
      "name": "language"
    }
  ],
  "metricHeaders": [
    {
      "name": "sessions",
      "type": "TYPE_INTEGER"
    }
  ],
  ...

}
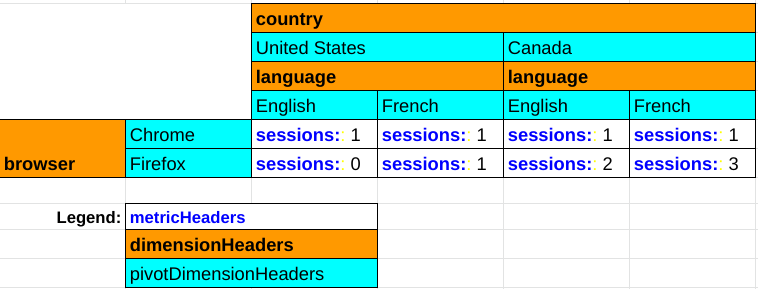
下图展示了透视报告响应的每个组成部分在呈现透视报告中的作用:
响应行
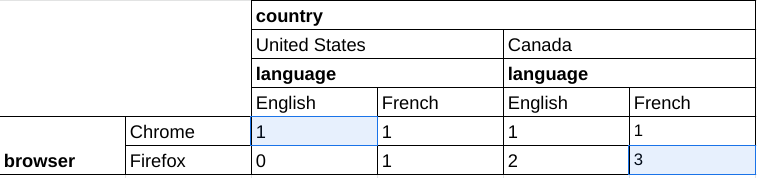
runPivotReport 和 batchRunPivotReports 方法的数据透视报告响应与 runReport 和 batchRunReports 等核心报告方法的响应不同,因为每个数据透视报告响应行表示表中的一个单元格,而在常规报告中,一个响应行表示表中完整的一行。
以下示例展示了透视报告响应的一部分,该响应针对的是包含 browser、country 和 language 透视维度以及 sessions 指标的查询。系统会单独返回数据透视报告的每个单元格:
  "rows": [
    {
      "dimensionValues": [
        {
          "value": "Chrome"
        },
        {
          "value": "United States"
        },
        {
          "value": "English"
        }
      ],
      "metricValues": [
        {
          "value": "1"
        }
      ]
    },
    {
      "dimensionValues": [
        {
          "value": "Firefox"
        },
        {
          "value": "Canada"
        },
        {
          "value": "French"
        }
      ],
      "metricValues": [
        {
          "value": "3"
        }
      ]
    },
    ...

  ]
此数据对应于下表中突出显示的两项数据:
客户端库
以下示例使用客户端库运行数据透视查询,以生成按国家/地区划分的会话数报告,并按浏览器维度透视数据。
PHP
use Google\Analytics\Data\V1beta\Client\BetaAnalyticsDataClient; use Google\Analytics\Data\V1beta\DateRange; use Google\Analytics\Data\V1beta\Dimension; use Google\Analytics\Data\V1beta\Metric; use Google\Analytics\Data\V1beta\OrderBy; use Google\Analytics\Data\V1beta\OrderBy\DimensionOrderBy; use Google\Analytics\Data\V1beta\OrderBy\MetricOrderBy; use Google\Analytics\Data\V1beta\Pivot; use Google\Analytics\Data\V1beta\RunPivotReportRequest; use Google\Analytics\Data\V1beta\RunPivotReportResponse; /** * Runs a pivot query to build a report of session counts by country, * pivoted by the browser dimension. * @param string $propertyId Your GA-4 Property ID */ function run_pivot_report(string $propertyId) { // Create an instance of the Google Analytics Data API client library. $client = new BetaAnalyticsDataClient(); // Make an API call. $request = (new RunPivotReportRequest()) ->setProperty('properties/' . $propertyId) ->setDateRanges([new DateRange([ 'start_date' => '2021-01-01', 'end_date' => '2021-01-30', ]), ]) ->setPivots([ new Pivot([ 'field_names' => ['country'], 'limit' => 250, 'order_bys' => [new OrderBy([ 'dimension' => new DimensionOrderBy([ 'dimension_name' => 'country', ]), ])], ]), new Pivot([ 'field_names' => ['browser'], 'offset' => 3, 'limit' => 3, 'order_bys' => [new OrderBy([ 'metric' => new MetricOrderBy([ 'metric_name' => 'sessions', ]), 'desc' => true, ])], ]), ]) ->setMetrics([new Metric(['name' => 'sessions'])]) ->setDimensions([ new Dimension(['name' => 'country']), new Dimension(['name' => 'browser']), ]); $response = $client->runPivotReport($request); printPivotReportResponse($response); } /** * Print results of a runPivotReport call. * @param RunPivotReportResponse $response */ function printPivotReportResponse(RunPivotReportResponse $response) { print 'Report result: ' . PHP_EOL; foreach ($response->getRows() as $row) { printf( '%s %s' . PHP_EOL, $row->getDimensionValues()[0]->getValue(), $row->getMetricValues()[0]->getValue() ); } }
Python
from google.analytics.data_v1beta import BetaAnalyticsDataClient from google.analytics.data_v1beta.types import ( DateRange, Dimension, Metric, OrderBy, Pivot, RunPivotReportRequest, ) def run_sample(): """Runs the sample.""" # TODO(developer): Replace this variable with your Google Analytics 4 # property ID before running the sample. property_id = "YOUR-GA4-PROPERTY-ID" run_pivot_report(property_id) def run_pivot_report(property_id="YOUR-GA4-PROPERTY-ID"): """Runs a pivot query to build a report of session counts by country, pivoted by the browser dimension.""" client = BetaAnalyticsDataClient() request = RunPivotReportRequest( property=f"properties/{property_id}", date_ranges=[DateRange(start_date="2021-01-01", end_date="2021-01-30")], pivots=[ Pivot( field_names=["country"], limit=250, order_bys=[ OrderBy( dimension=OrderBy.DimensionOrderBy(dimension_name="country") ) ], ), Pivot( field_names=["browser"], offset=3, limit=3, order_bys=[ OrderBy( metric=OrderBy.MetricOrderBy(metric_name="sessions"), desc=True ) ], ), ], metrics=[Metric(name="sessions")], dimensions=[Dimension(name="country"), Dimension(name="browser")], ) response = client.run_pivot_report(request) print_run_pivot_report_response(response) def print_run_pivot_report_response(response): """Prints results of a runPivotReport call.""" print("Report result:") for row in response.rows: for dimension_value in row.dimension_values: print(dimension_value.value) for metric_value in row.metric_values: print(metric_value.value)
Node.js
// TODO(developer): Uncomment this variable and replace with your // Google Analytics 4 property ID before running the sample. // propertyId = 'YOUR-GA4-PROPERTY-ID'; // Imports the Google Analytics Data API client library. const {BetaAnalyticsDataClient} = require('@google-analytics/data'); // Initialize client that will be used to send requests. This client only // needs to be created once, and can be reused for multiple requests. const analyticsDataClient = new BetaAnalyticsDataClient(); // Runs a pivot query to build a report of session counts by country, pivoted // by the browser dimension. async function runPivotReport() { const [response] = await analyticsDataClient.runPivotReport({ property: `properties/${propertyId}`, dateRanges: [ { startDate: '2021-01-01', endDate: '2021-01-30', }, ], pivots: [ { fieldNames: ['country'], limit: 250, orderBys: [ { dimension: { dimensionName: 'country', }, }, ], }, { fieldNames: ['browser'], offset: 3, limit: 3, orderBys: [ { metric: { metricName: 'sessions', }, desc: true, }, ], }, ], metrics: [ { name: 'sessions', }, ], dimensions: [ { name: 'country', }, { name: 'browser', }, ], }); printPivotReportResponse(response); } runPivotReport(); // Prints results of a runReport call. function printPivotReportResponse(response) { console.log('Report result:'); response.rows.forEach((row) => { row.dimensionValues.forEach((dimensionValue) => { console.log(dimensionValue.value); }); row.metricValues.forEach((metricValue) => { console.log(metricValue.value); }); }); }
演示应用
如需查看如何使用 JavaScript 构建和显示透视报告的示例,请参阅 Google Analytics API v1 透视报告演示应用。