
Google Analytics Data API v1 可讓您產生樞紐分析表。資料透視表是一種資料摘要工具,可透過以一或多個維度為資料主軸,重新整理表格中的資訊,進而將資料視覺化。
舉例來說,請參考下列原始資料表:
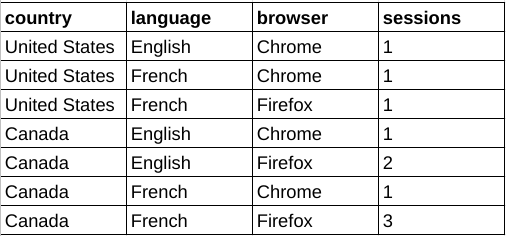
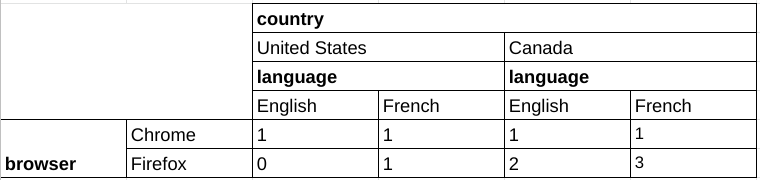
使用這項資料時,您可以建構資料透視表,依瀏覽器細分工作階段資料,並選取國家/地區和語言維度做為額外的透視表。
與核心報表共用的功能
許多共用功能都具有相同的語意,因此樞紐分析報表要求與核心報表要求相同。舉例來說,在樞紐分析表和核心報表中,分頁、維度篩選器和使用者屬性的運作方式相同。本指南著重說明樞紐報表功能。如要熟悉 Data API 第 1 版的核心報表功能,請參閱報表基本概念指南和進階用途指南。
透視型報表方法
Data API v1 在下列報表方法中支援樞紐功能:
runPivotReport:這種方法會傳回 Google Analytics 事件資料的自訂樞紐分析報表。每個資料透視表都會說明報表回應中顯示的維度資料欄和資料列。
batchRunPivotReports:這是
runPivotReport方法的批次版本,可讓您使用單一 API 呼叫產生多份報表。
選取報表實體
所有 Data API v1 方法都必須在網址要求路徑中指定 Google Analytics 資源 ID,格式為 properties/GA_PROPERTY_ID,例如:
POST https://analyticsdata.googleapis.com/v1beta/properties/GA_PROPERTY_ID:runPivotReport
系統會根據指定 Google Analytics 資源中收集的 Google Analytics 事件資料,產生結果報表。
如果您使用資料 API 用戶端程式庫,則不需要手動操控要求網址路徑。大多數 API 用戶端都會提供 property 參數,並預期字串格式為 properties/GA_PROPERTY_ID。如需使用用戶端程式庫的範例,請參閱快速入門指南。
透視型報表要求
如要使用樞紐分析表建構要求,請使用 runPivotReport 或 batchRunPivotReports 方法。
如要要求透視資料,可以建構 RunPivotReportRequest 物件。建議您先使用下列要求參數:
- 「dateRanges」dateRanges欄位中的有效項目。
- dimensions 欄位中至少有一個有效項目。
- metrics 欄位中至少有一個有效項目。
- pivots 欄位中至少有兩個有效的樞紐項目。
以下是包含建議欄位的範例要求:
HTTP
POST https://analyticsdata.googleapis.com/v1beta/properties/GA_PROPERTY_ID:runPivotReport
  {
    "dateRanges": [{ "startDate": "2020-09-01", "endDate": "2020-09-15" }],
    "dimensions": [
        { "name": "browser" },
        { "name": "country" },
        { "name": "language" }
      ],
    "metrics": [{ "name": "sessions" }],
    "pivots": [
      {
        "fieldNames": [
          "browser"
        ],
        "limit": 5
      },
      {
        "fieldNames": [
          "country"
        ],
        "limit": 250
      },
      {
        "fieldNames": [
          "language"
        ],
        "limit": 15
      }
    ]
  }
資料透視
在要求主體的 pivot 欄位中使用 Pivot 物件,定義報表樞紐。每個 Pivot 都會說明報表回應中顯示的維度資料欄和資料列。
只要每個樞紐的 limit 參數乘積不超過 100,000,Data API 第 1 版就支援多個樞紐。
下列程式碼片段示範如何使用 pivots,依國家/地區建立工作階段計數報表,並以 browser 維度為樞紐。請注意,查詢如何使用 orderBys 欄位進行排序,以及使用 limit 和 offset 欄位實作分頁。
    "pivots": [
      {
        "fieldNames": [
          "country"
        ],
        "limit": 250,
        "orderBys": [
          {
            "dimension": {
              "dimensionName": "country"
            }
          }
        ]
      },
      {
        "fieldNames": [
          "browser"
        ],
        "offset": 3,
        "limit": 3,
        "orderBys": [
          {
            "metric": {
              "metricName": "sessions"
            },
            "desc": true
          }
        ]
      }
    ],
    ...
尺寸
維度會說明並分組網站或應用程式的事件資料。舉例來說,「城市」city 維度會指出每個事件的來源城市 (例如「巴黎」或「紐約」)。在報表要求中,您可以指定零或多個維度。
維度必須在要求主體的 dimensions 欄位中定義。如要在報表中顯示這些維度,也必須在 Pivot 物件的 fieldNames 欄位中列出這些維度。如果維度未用於透視查詢的任何透視,就不會顯示在報表中。樞紐分析表不一定要包含所有維度。fieldNames維度只能用於篩選器,不能用於任何資料透視表的fieldNames。
下列程式碼片段示範如何針對具有 browser、country 和 language 樞紐的資料表,使用 dimension 和 fieldNames 欄位:
    "pivots": [
      {
        "fieldNames": [
          "browser"
        ],
        "limit": 5,
        "orderBys": [
          {
            "metric": {
              "metricName": "sessions"
            },
            "desc": true
          }
        ]
      },
      {
        "fieldNames": [
          "country"
        ],
        "limit": 250,
        "orderBys": [
          {
            "dimension": {
              "dimensionName": "country"
            }
          }
        ]
      },
      {
        "fieldNames": [
          "language"
        ],
        "limit": 10
      }
    ],
指標
指標是網站或應用程式事件資料的量化評估。在報表要求中,您可以指定一或多個指標。如需可在要求中指定的 API 指標名稱完整清單,請參閱「API 指標」。
在資料透視報表要求中,指標是使用要求主體的 metrics 欄位定義,這與核心報表方法類似。
以下範例指定在報表中將工作階段數做為指標值:
    "metrics": [
      {
        "name": "sessions"
      }
    ],
指標匯總
使用 Pivot 物件的 metricAggregations 欄位,計算每個樞紐的匯總指標值。
只有在要求中指定 metricAggregations 欄位時,系統才會計算匯總資料。
以下範例是查詢的程式碼片段,要求 browser 樞紐分析維度的總計:
"pivots": [
  {
    "fieldNames": [
      "browser"
    ],
    "limit": 10,
    "metricAggregations": [
      "TOTAL",
    ]
  },
  ...
計算出的指標會傳回至 RunPivotReportResponse 物件的 aggregates 欄位。如果是匯總指標列,dimensionValues 欄位會包含 RESERVED_TOTAL、RESERVED_MAX 或 RESERVED_MIN 的特殊值。
  "aggregates": [
    {
      "dimensionValues": [
        {
          "value": "Chrome"
        },
        {
          "value": "RESERVED_TOTAL"
        },
        {
          "value": "RESERVED_TOTAL"
        }
      ],
      "metricValues": [
        {
          "value": "4"
        }
      ]
    },
    {
      "dimensionValues": [
        {
          "value": "Firefox"
        },
        {
          "value": "RESERVED_TOTAL"
        },
        {
          "value": "RESERVED_TOTAL"
        }
      ],
      "metricValues": [
        {
          "value": "6"
        }
      ]
    },
  ....

  }
分頁
與核心報表方法類似,樞紐分析表要求可讓您在 Pivot 物件中指定 limit 和 offset 欄位,以實作分頁功能。分頁設定會個別套用至每個資料透視表。
每個 Pivot 物件都必須有 limit 欄位,才能限制報表基數。
只要每個資料透視表的 limit 參數乘積不超過 100,000,Data API 第 1 版就支援多個資料透視表。
下列程式碼片段示範如何使用 offset 和 limit 欄位,以 10 的位移量擷取接下來五個 language 維度:
      {
        "fieldNames": [
          "language"
        ],
        "offset": 10,
        "limit": 5
      }
篩選
與核心報表功能類似,如要在透視表報表要求中篩選維度,必須使用要求範圍的維度篩選器。
排序
您可以使用 Pivot 物件的 orderBys 欄位,個別控管每個樞紐的樞紐報表查詢排序行為,該欄位包含 OrderBy 物件清單。
每個 OrderBy 都可以包含下列其中一項:
- DimensionOrderBy,依維度值排序結果。
- MetricOrderBy:依指標值排序結果。
- PivotOrderBy 用於透視查詢,並依透視資料欄群組中的指標值排序結果。
這個範例顯示樞紐定義的程式碼片段,可根據 browser 維度樞紐分析報表,並依 sessions 指標以遞減順序排序結果。
      {
        "fieldNames": [
          "browser"
        ],
        "limit": 5,
        "orderBys": [
          {
            "metric": {
              "metricName": "sessions"
            },
            "desc": true
          }
        ]
      }
檢舉回覆
樞紐報表 API 要求的樞紐報表回應主要包含標頭和資料列。
回應標頭
資料透視報表標題包含 PivotHeaders、DimensionHeaders 和 MetricHeaders,列出資料透視報表中的資料欄。
舉例來說,如果報表包含 browser、country 和 language 資料透視維度,以及 sessions 指標,就會產生如下的標題:
{
  "pivotHeaders": [
    {
      "pivotDimensionHeaders": [
        {
          "dimensionValues": [
            {
              "value": "Chrome"
            }
          ]
        },
        {
          "dimensionValues": [
            {
              "value": "Firefox"
            }
          ]
        },
        ...

      ],
      ...
    },
    {
      "pivotDimensionHeaders": [
        {
          "dimensionValues": [
            {
              "value": "United States"
            }
          ]
        },
        {
          "dimensionValues": [
            {
              "value": "Canada"
            }
          ]
        },
        ...

      ],
      ...
    },
    {
      "pivotDimensionHeaders": [
        {
          "dimensionValues": [
            {
              "value": "English"
            }
          ]
        },
        {
          "dimensionValues": [
            {
              "value": "French"
            }
          ]
        },
        ...

      ],
      ...
    }
  ],
  "dimensionHeaders": [
    {
      "name": "browser"
    },
    {
      "name": "country"
    },
    {
      "name": "language"
    }
  ],
  "metricHeaders": [
    {
      "name": "sessions",
      "type": "TYPE_INTEGER"
    }
  ],
  ...

}
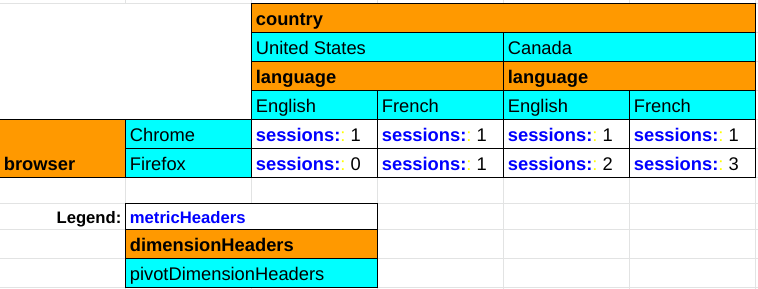
下圖說明樞紐分析表回應中各個元件的角色,以及如何轉譯樞紐分析表:
回覆列
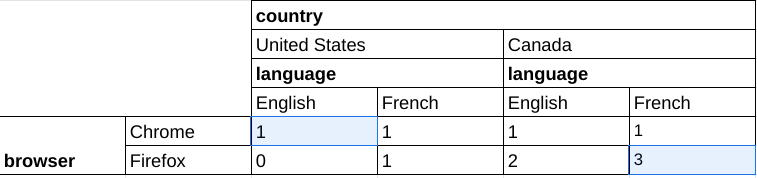
runPivotReport 和 batchRunPivotReports 方法的樞紐分析表報表回應,與 runReport 和 batchRunReports 等核心報表方法的不同之處在於,每個樞紐分析表報表回應資料列代表表格的單一儲存格,而一般報表中的單一回應資料列則代表完整的表格列。
下例顯示查詢的資料透視報表回應片段,其中包含 browser、country 和 language 資料透視維度,以及 sessions 指標。樞紐分析報表的每個儲存格都會個別傳回:
  "rows": [
    {
      "dimensionValues": [
        {
          "value": "Chrome"
        },
        {
          "value": "United States"
        },
        {
          "value": "English"
        }
      ],
      "metricValues": [
        {
          "value": "1"
        }
      ]
    },
    {
      "dimensionValues": [
        {
          "value": "Firefox"
        },
        {
          "value": "Canada"
        },
        {
          "value": "French"
        }
      ],
      "metricValues": [
        {
          "value": "3"
        }
      ]
    },
    ...

  ]
這項資料對應於下表醒目顯示的兩個儲存格:
用戶端程式庫
下列範例使用用戶端程式庫執行樞紐查詢,以依國家/地區建立工作階段計數報表,並依瀏覽器維度進行樞紐分析。
PHP
use Google\Analytics\Data\V1beta\Client\BetaAnalyticsDataClient; use Google\Analytics\Data\V1beta\DateRange; use Google\Analytics\Data\V1beta\Dimension; use Google\Analytics\Data\V1beta\Metric; use Google\Analytics\Data\V1beta\OrderBy; use Google\Analytics\Data\V1beta\OrderBy\DimensionOrderBy; use Google\Analytics\Data\V1beta\OrderBy\MetricOrderBy; use Google\Analytics\Data\V1beta\Pivot; use Google\Analytics\Data\V1beta\RunPivotReportRequest; use Google\Analytics\Data\V1beta\RunPivotReportResponse; /** * Runs a pivot query to build a report of session counts by country, * pivoted by the browser dimension. * @param string $propertyId Your GA-4 Property ID */ function run_pivot_report(string $propertyId) { // Create an instance of the Google Analytics Data API client library. $client = new BetaAnalyticsDataClient(); // Make an API call. $request = (new RunPivotReportRequest()) ->setProperty('properties/' . $propertyId) ->setDateRanges([new DateRange([ 'start_date' => '2021-01-01', 'end_date' => '2021-01-30', ]), ]) ->setPivots([ new Pivot([ 'field_names' => ['country'], 'limit' => 250, 'order_bys' => [new OrderBy([ 'dimension' => new DimensionOrderBy([ 'dimension_name' => 'country', ]), ])], ]), new Pivot([ 'field_names' => ['browser'], 'offset' => 3, 'limit' => 3, 'order_bys' => [new OrderBy([ 'metric' => new MetricOrderBy([ 'metric_name' => 'sessions', ]), 'desc' => true, ])], ]), ]) ->setMetrics([new Metric(['name' => 'sessions'])]) ->setDimensions([ new Dimension(['name' => 'country']), new Dimension(['name' => 'browser']), ]); $response = $client->runPivotReport($request); printPivotReportResponse($response); } /** * Print results of a runPivotReport call. * @param RunPivotReportResponse $response */ function printPivotReportResponse(RunPivotReportResponse $response) { print 'Report result: ' . PHP_EOL; foreach ($response->getRows() as $row) { printf( '%s %s' . PHP_EOL, $row->getDimensionValues()[0]->getValue(), $row->getMetricValues()[0]->getValue() ); } }
Python
from google.analytics.data_v1beta import BetaAnalyticsDataClient from google.analytics.data_v1beta.types import ( DateRange, Dimension, Metric, OrderBy, Pivot, RunPivotReportRequest, ) def run_sample(): """Runs the sample.""" # TODO(developer): Replace this variable with your Google Analytics 4 # property ID before running the sample. property_id = "YOUR-GA4-PROPERTY-ID" run_pivot_report(property_id) def run_pivot_report(property_id="YOUR-GA4-PROPERTY-ID"): """Runs a pivot query to build a report of session counts by country, pivoted by the browser dimension.""" client = BetaAnalyticsDataClient() request = RunPivotReportRequest( property=f"properties/{property_id}", date_ranges=[DateRange(start_date="2021-01-01", end_date="2021-01-30")], pivots=[ Pivot( field_names=["country"], limit=250, order_bys=[ OrderBy( dimension=OrderBy.DimensionOrderBy(dimension_name="country") ) ], ), Pivot( field_names=["browser"], offset=3, limit=3, order_bys=[ OrderBy( metric=OrderBy.MetricOrderBy(metric_name="sessions"), desc=True ) ], ), ], metrics=[Metric(name="sessions")], dimensions=[Dimension(name="country"), Dimension(name="browser")], ) response = client.run_pivot_report(request) print_run_pivot_report_response(response) def print_run_pivot_report_response(response): """Prints results of a runPivotReport call.""" print("Report result:") for row in response.rows: for dimension_value in row.dimension_values: print(dimension_value.value) for metric_value in row.metric_values: print(metric_value.value)
Node.js
// TODO(developer): Uncomment this variable and replace with your // Google Analytics 4 property ID before running the sample. // propertyId = 'YOUR-GA4-PROPERTY-ID'; // Imports the Google Analytics Data API client library. const {BetaAnalyticsDataClient} = require('@google-analytics/data'); // Initialize client that will be used to send requests. This client only // needs to be created once, and can be reused for multiple requests. const analyticsDataClient = new BetaAnalyticsDataClient(); // Runs a pivot query to build a report of session counts by country, pivoted // by the browser dimension. async function runPivotReport() { const [response] = await analyticsDataClient.runPivotReport({ property: `properties/${propertyId}`, dateRanges: [ { startDate: '2021-01-01', endDate: '2021-01-30', }, ], pivots: [ { fieldNames: ['country'], limit: 250, orderBys: [ { dimension: { dimensionName: 'country', }, }, ], }, { fieldNames: ['browser'], offset: 3, limit: 3, orderBys: [ { metric: { metricName: 'sessions', }, desc: true, }, ], }, ], metrics: [ { name: 'sessions', }, ], dimensions: [ { name: 'country', }, { name: 'browser', }, ], }); printPivotReportResponse(response); } runPivotReport(); // Prints results of a runReport call. function printPivotReportResponse(response) { console.log('Report result:'); response.rows.forEach((row) => { row.dimensionValues.forEach((dimensionValue) => { console.log(dimensionValue.value); }); row.metricValues.forEach((metricValue) => { console.log(metricValue.value); }); }); }
試用版應用程式
如要瞭解如何使用 JavaScript 建構及顯示樞紐分析表,請參閱 Google Analytics API v1 樞紐分析表範例應用程式。