
本頁說明如何從 Google 試算表匯出圖表,並加入 Google 簡報。
在簡報中加入圖表,可讓簡報更具影響力,並讓觀眾瞭解資料的意義。圖表是獨一無二的強大工具,可顯示資料集中的模式或趨勢,並協助您清楚呈現量化資料。
上述影片說明如何根據試算表資料產生投影片。其中包含完整範例 (Python),可將圖表新增至投影片,並將試算表儲存格資料匯入表格。
關於新增圖表
在簡報中呈現量化資訊時,資料圖表可讓簡報更豐富。您可以使用 Slides API 插入在 Google 試算表中建立的任何圖表,包括長條圖、折線圖、圓餅圖等。
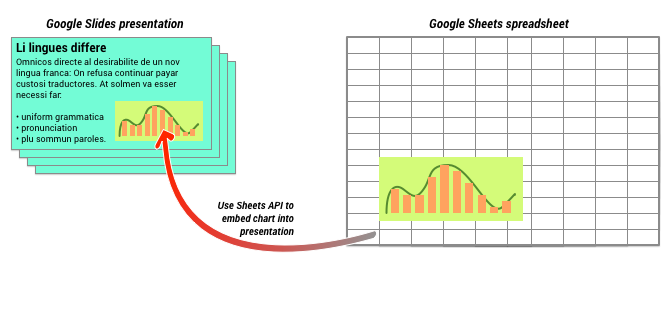
如上圖所示,您必須先在 Google 試算表中建立圖表。 圖表建立完成後,即可嵌入簡報。
管理簡報中圖表的一般流程如下:
- 在 Google 試算表中建立圖表。
- 使用 Sheets API 讀取產生的 EmbeddedChart 圖表 ID。
- 使用 CreateSheetsChartRequest 一次,即可將圖表新增至投影片。
- 視需要使用 RefreshSheetsChartRequest,將圖表同步處理至來源資料。
靜態圖表與連結圖表
使用 API 將圖表新增至簡報時,您需要指定一個參數,也就是 LinkingMode。這會決定圖表是以靜態圖片形式新增,還是以日後可重新整理的物件形式新增。
在下列情況下,請使用 LINKED 模式:
- 您想在日後重新整理圖表,反映基礎資料的變更。
- 您希望協作者取得含有來源圖表的試算表連結。
在下列情況下,請使用 NOT_LINKED_IMAGE (靜態) 模式:
- 您希望圖表日後永遠不會變更。
- 您不希望協作者看到來源試算表的連結。
存取 Google 試算表的範圍
在投影片中新增圖表時,Slides API 必須存取 Google 試算表中的圖表。也就是說,您的要求必須使用下列其中一個範圍:
https://www.googleapis.com/auth/spreadsheets.readonly(建議)https://www.googleapis.com/auth/spreadsheetshttps://www.googleapis.com/auth/drive.readonlyhttps://www.googleapis.com/auth/drive
一般來說,spreadsheets.readonly 範圍是最佳選擇,因為這是最嚴格的範圍。不過,如果您的應用程式已使用上述其他範圍,請直接使用該範圍。
新增圖表
如要新增圖表,您必須知道 Google 試算表中圖表的試算表 ID 和圖表 ID。然後呼叫 batchUpdate 方法,使用 CreateSheetsChartRequest 新增圖表。
以下範例會擷取圖表,並以 LINKED 形式新增至投影片,以便日後重新整理。
Apps Script
/**
 * Embed a Sheets chart (indicated by the spreadsheetId and sheetChartId) onto
 *   a page in the presentation. Setting the linking mode as 'LINKED' allows the
 *   chart to be refreshed if the Sheets version is updated.
 * @param {string} presentationId
 * @param {string} pageId
 * @param {string} shapeId
 * @param {string} sheetChartId
 * @returns {*}
 */
function createSheetsChart(presentationId, pageId, shapeId, sheetChartId) {
  const emu4M = {
    magnitude: 4000000,
    unit: "EMU",
  };
  const presentationChartId = "MyEmbeddedChart";
  const requests = [
    {
      createSheetsChart: {
        objectId: presentationChartId,
        spreadsheetId: shapeId,
        chartId: sheetChartId,
        linkingMode: "LINKED",
        elementProperties: {
          pageObjectId: pageId,
          size: {
            height: emu4M,
            width: emu4M,
          },
          transform: {
            scaleX: 1,
            scaleY: 1,
            translateX: 100000,
            translateY: 100000,
            unit: "EMU",
          },
        },
      },
    },
  ];

  // Execute the request.
  try {
    const batchUpdateResponse = Slides.Presentations.batchUpdate(
      {
        requests: requests,
      },
      presentationId,
    );
    console.log("Added a linked Sheets chart with ID: %s", presentationChartId);

    return batchUpdateResponse;
  } catch (err) {
    // TODO (Developer) - Handle exception
    console.log("Failed with error: %s", err.error);
  }
}
Go
// Embed a Sheets chart (indicated by the spreadsheetId and sheetChartId) onto
// a page in the presentation. Setting the linking mode as "LINKED" allows the
// chart to be refreshed if the Sheets version is updated.
emu4M := slides.Dimension{Magnitude: 4000000, Unit: "EMU"}
presentationChartId := "MyEmbeddedChart"
requests := []*slides.Request{{
	CreateSheetsChart: &slides.CreateSheetsChartRequest{
		ObjectId:      presentationChartId,
		SpreadsheetId: spreadsheetId,
		ChartId:       sheetChartId,
		LinkingMode:   "LINKED",
		ElementProperties: &slides.PageElementProperties{
			PageObjectId: pageId,
			Size: &slides.Size{
				Height: &emu4M,
				Width:  &emu4M,
			},
			Transform: &slides.AffineTransform{
				ScaleX:     1.0,
				ScaleY:     1.0,
				TranslateX: 100000.0,
				TranslateY: 100000.0,
				Unit:       "EMU",
			},
		},
	},
}}

// Execute the requests.
body := &slides.BatchUpdatePresentationRequest{Requests: requests}
response, _ := slidesService.Presentations.BatchUpdate(presentationId, body).Do()
fmt.Printf("Added a linked Sheets chart with ID %s", presentationChartId)
Java
import com.google.api.client.googleapis.json.GoogleJsonError;
import com.google.api.client.googleapis.json.GoogleJsonResponseException;
import com.google.api.client.http.HttpRequestInitializer;
import com.google.api.client.http.javanet.NetHttpTransport;
import com.google.api.client.json.gson.GsonFactory;
import com.google.api.services.slides.v1.Slides;
import com.google.api.services.slides.v1.SlidesScopes;
import com.google.api.services.slides.v1.model.AffineTransform;
import com.google.api.services.slides.v1.model.BatchUpdatePresentationRequest;
import com.google.api.services.slides.v1.model.BatchUpdatePresentationResponse;
import com.google.api.services.slides.v1.model.CreateSheetsChartRequest;
import com.google.api.services.slides.v1.model.Dimension;
import com.google.api.services.slides.v1.model.PageElementProperties;
import com.google.api.services.slides.v1.model.Request;
import com.google.api.services.slides.v1.model.Size;
import com.google.auth.http.HttpCredentialsAdapter;
import com.google.auth.oauth2.GoogleCredentials;

import java.io.IOException;
import java.util.ArrayList;
import java.util.Collections;
import java.util.List;

/* Class to demonstrate the use of Slides Create Chart API */
public class CreateSheetsChart {
  /**
   * Adds chart from spreadsheet to slides as linked.
   *
   * @param presentationId - id of the presentation.
   * @param pageId         - id of the page.
   * @param spreadsheetId  - id of the spreadsheet.
   * @param sheetChartId   - id of the chart in sheets.
   * @return presentation chart id
   * @throws IOException - if credentials file not found.
   */
  public static BatchUpdatePresentationResponse createSheetsChart(
      String presentationId, String pageId, String spreadsheetId, Integer sheetChartId)
      throws IOException {
        /* Load pre-authorized user credentials from the environment.
           TODO(developer) - See https://developers.google.com/identity for
            guides on implementing OAuth2 for your application. */
    GoogleCredentials credentials = GoogleCredentials.getApplicationDefault()
        .createScoped(Collections.singleton(SlidesScopes.PRESENTATIONS));
    HttpRequestInitializer requestInitializer = new HttpCredentialsAdapter(
        credentials);

    // Create the slides API client
    Slides service = new Slides.Builder(new NetHttpTransport(),
        GsonFactory.getDefaultInstance(),
        requestInitializer)
        .setApplicationName("Slides samples")
        .build();

    // Embed a Sheets chart (indicated by the spreadsheetId and sheetChartId) onto
    // a page in the presentation. Setting the linking mode as "LINKED" allows the
    // chart to be refreshed if the Sheets version is updated.
    List<Request> requests = new ArrayList<>();
    Dimension emu4M = new Dimension().setMagnitude(4000000.0).setUnit("EMU");
    String presentationChartId = "MyEmbeddedChart";
    requests.add(new Request()
        .setCreateSheetsChart(new CreateSheetsChartRequest()
            .setObjectId(presentationChartId)
            .setSpreadsheetId(spreadsheetId)
            .setChartId(sheetChartId)
            .setLinkingMode("LINKED")
            .setElementProperties(new PageElementProperties()
                .setPageObjectId(pageId)
                .setSize(new Size()
                    .setHeight(emu4M)
                    .setWidth(emu4M))
                .setTransform(new AffineTransform()
                    .setScaleX(1.0)
                    .setScaleY(1.0)
                    .setTranslateX(100000.0)
                    .setTranslateY(100000.0)
                    .setUnit("EMU")))));

    BatchUpdatePresentationResponse response = null;
    try {
      // Execute the request.
      BatchUpdatePresentationRequest body =
          new BatchUpdatePresentationRequest().setRequests(requests);
      response = service.presentations().batchUpdate(presentationId, body).execute();
      System.out.println("Added a linked Sheets chart with ID " + presentationChartId);
    } catch (GoogleJsonResponseException e) {
      // TODO(developer) - handle error appropriately
      GoogleJsonError error = e.getDetails();
      if (error.getCode() == 404) {
        System.out.printf("Presentation not found with id '%s'.\n", presentationId);
      } else {
        throw e;
      }
    }
    return response;
  }
}
JavaScript
function createSheetsChart(presentationId, pageId, shapeId, sheetChartId, callback) {
  // Embed a Sheets chart (indicated by the spreadsheetId and sheetChartId) onto
  // a page in the presentation. Setting the linking mode as "LINKED" allows the
  // chart to be refreshed if the Sheets version is updated.
  const emu4M = {
    magnitude: 4000000,
    unit: 'EMU',
  };
  const presentationChartId = 'MyEmbeddedChart';
  const requests = [{
    createSheetsChart: {
      objectId: presentationChartId,
      spreadsheetId: shapeId,
      chartId: sheetChartId,
      linkingMode: 'LINKED',
      elementProperties: {
        pageObjectId: pageId,
        size: {
          height: emu4M,
          width: emu4M,
        },
        transform: {
          scaleX: 1,
          scaleY: 1,
          translateX: 100000,
          translateY: 100000,
          unit: 'EMU',
        },
      },
    },
  }];
  // Execute the request.
  try {
    gapi.client.slides.presentations.batchUpdate({
      presentationId: presentationId,
      requests: requests,
    }).then((batchUpdateResponse) => {
      console.log(`Added a linked Sheets chart with ID: ${presentationChartId}`);
      if (callback) callback(batchUpdateResponse.result);
    });
  } catch (err) {
    document.getElementById('content').innerText = err.message;
    return;
  }
}
Node.js
import {GoogleAuth} from 'google-auth-library';
import {google} from 'googleapis';

/**
 * Embeds a Sheets chart into a presentation.
 * @param {string} presentationId The ID of the presentation.
 * @param {string} pageId The ID of the page to embed the chart on.
 * @param {string} spreadsheetId The ID of the spreadsheet containing the chart.
 * @param {string} sheetChartId The ID of the chart in the spreadsheet.
 * @return {Promise<object>} The response from the batch update.
 */
async function createSheetsChart(
  presentationId,
  pageId,
  spreadsheetId,
  sheetChartId,
) {
  // Authenticate with Google and get an authorized client.
  const auth = new GoogleAuth({
    scopes: 'https://www.googleapis.com/auth/presentations',
  });

  // Create a new Slides API client.
  const service = google.slides({version: 'v1', auth});

  // The size of the embedded chart, in English Metric Units (EMUs).
  const emu4M = {
    magnitude: 4000000,
    unit: 'EMU',
  };

  // The ID to use for the embedded chart.
  const presentationChartId = 'MyEmbeddedChart';

  // The request to create a new chart.
  const requests = [
    {
      createSheetsChart: {
        objectId: presentationChartId,
        spreadsheetId,
        chartId: sheetChartId,
        // Linking mode allows the chart to be updated if the source sheet changes.
        linkingMode: 'LINKED',
        elementProperties: {
          pageObjectId: pageId,
          size: {
            height: emu4M,
            width: emu4M,
          },
          transform: {
            scaleX: 1,
            scaleY: 1,
            translateX: 100000,
            translateY: 100000,
            unit: 'EMU',
          },
        },
      },
    },
  ];

  // Execute the batch update request to create the chart.
  const batchUpdateResponse = await service.presentations.batchUpdate({
    presentationId,
    requestBody: {
      requests,
    },
  });
  console.log(`Added a linked Sheets chart with ID: ${presentationChartId}`);
  return batchUpdateResponse.data;
}
PHP
<?php
use Google\Client;
use Google\Service\Drive;
use Google\Service\Slides;
use Google\Service\Slides\Request;


function createSheetsChart($presentationId, $pageId, $spreadsheetId, $sheetChartId)
{
    /* Load pre-authorized user credentials from the environment.
       TODO(developer) - See https://developers.google.com/identity for
        guides on implementing OAuth2 for your application. */
    $client = new Google\Client();
    $client->useApplicationDefaultCredentials();
    $client->addScope(Google\Service\Drive::DRIVE);
    $slidesService = new Google_Service_Slides($client);
    // Embed a Sheets chart (indicated by the spreadsheet_id and sheet_chart_id) onto
    // a page in the presentation. Setting the linking mode as "LINKED" allows the
    // chart to be refreshed if the Sheets version is updated.
    try {
        //creating new presentaion chart
        $presentationChartId = 'MyEmbeddedChart';
        $emu4M = array('magnitude' => 4000000, 'unit' => 'EMU');
        $requests = array();
        $requests[] = new Google_Service_Slides_Request(
            array(
                'createSheetsChart' => array(
                    'spreadsheetId' => $spreadsheetId,
                    'chartId' => $sheetChartId,
                    'linkingMode' => 'LINKED',
                    'elementProperties' => array(
                        'pageObjectId' => $pageId,
                        'size' => array(
                            'height' => $emu4M,
                            'width' => $emu4M
                        ),
                        'transform' => array(
                            'scaleX' => 1,
                            'scaleY' => 1,
                            'translateX' => 100000,
                            'translateY' => 100000,
                            'unit' => 'EMU'
                        )
                    )
                )
            ));

        // Execute the request.
        $batchUpdateRequest = new Google_Service_Slides_BatchUpdatePresentationRequest(array(
            'requests' => $requests
        ));
        $response = $slidesService->presentations->batchUpdate($presentationId, $batchUpdateRequest);
        printf("Added a linked Sheets chart with ID: %s\n", $response->getPresentationId());
        return $response;
    } catch (Exception $e) {
        echo 'Message: ' . $e->getMessage();
    }
}
Python
import google.auth
from googleapiclient.discovery import build
from googleapiclient.errors import HttpError


def create_sheets_chart(
    presentation_id, page_id, spreadsheet_id, sheet_chart_id
):
  """
  create_sheets_chart the user has access to.
  Load pre-authorized user credentials from the environment.
  TODO(developer) - See https://developers.google.com/identity
  for guides on implementing OAuth2 for the application.
  """
  creds, _ = google.auth.default()
  # pylint: disable=maybe-no-member
  try:
    slides_service = build("slides", "v1", credentials=creds)
    # Embed a Sheets chart (indicated by the spreadsheet_id and
    # sheet_chart_id) onto a page in the presentation.
    # Setting the linking mode as "LINKED" allows the
    # chart to be refreshed if the Sheets version is updated.

    emu4m = {"magnitude": 4000000, "unit": "EMU"}

    presentation_chart_id = "MyEmbeddedChart"
    requests = [
        {
            "createSheetsChart": {
                "objectId": presentation_chart_id,
                "spreadsheetId": spreadsheet_id,
                "chartId": sheet_chart_id,
                "linkingMode": "LINKED",
                "elementProperties": {
                    "pageObjectId": page_id,
                    "size": {"height": emu4m, "width": emu4m},
                    "transform": {
                        "scaleX": 1,
                        "scaleY": 1,
                        "translateX": 100000,
                        "translateY": 100000,
                        "unit": "EMU",
                    },
                },
            }
        }
    ]

    # Execute the request.
    body = {"requests": requests}
    response = (
        slides_service.presentations()
        .batchUpdate(presentationId=presentation_id, body=body)
        .execute()
    )
    print(f"Added a linked Sheets chart with ID: {presentation_chart_id}")
    return response
  except HttpError as error:
    print(f"An error occurred: {error}")
    return error


if __name__ == "__main__":
  # Put the presentation_id, Page_id of slides
  # spreadsheet_id and sheet_chart_id to be submitted.
  create_sheets_chart(
      "10QnVUx1X2qHsL17WUidGpPh_SQhXYx40CgIxaKk8jU4",
      "FIRSTSLIDE",
      "17eqFZl_WK4WVixX8PjvjfLD77DraoFwMDXeiHB3dvuM",
      "1107320627",
  )
Ruby
# Embed a Sheets chart (indicated by the spreadsheet_id and sheet_chart_id) onto
# a page in the presentation. Setting the linking mode as "LINKED" allows the
# chart to be refreshed if the Sheets version is updated.
emu4M = {
  magnitude: 4000000,
  unit:      'EMU'
}
presentation_chart_id = 'my_embedded_chart'
requests = [{
  create_sheets_chart: {
    object_id_prop:     presentation_chart_id,
    spreadsheet_id:     spreadsheet_id,
    chart_id:           sheet_chart_id,
    linking_mode:       'LINKED',
    element_properties: {
      page_object_id: page_id,
      size:           {
        height: emu4M,
        width:  emu4M
      },
      transform:      {
        scale_x:     1,
        scale_y:     1,
        translate_x: 100000,
        translate_y: 100000,
        unit:        'EMU'
      }
    }
  }
}]

# Execute the request.
req = Google::Apis::SlidesV1::BatchUpdatePresentationRequest.new(requests: requests)
response = slides_service.batch_update_presentation(presentation_id, req)

puts "Added a linked Sheets chart with ID: #{presentation_chart_id}"
重新整理圖表
如果您在簡報中嵌入 LINKED 圖表,隨時可以使用 RefreshSheetsChartRequest 重新整理圖表。這會更新圖表,使其與基礎 Google 試算表圖表和資料保持同步。
以下範例會重新整理現有圖表:
Apps Script
/**
 * Refresh the sheets charts
 * @param {string} presentationId
 * @param {string} presentationChartId
 * @returns {*}
 */
function refreshSheetsChart(presentationId, presentationChartId) {
  const requests = [
    {
      refreshSheetsChart: {
        objectId: presentationChartId,
      },
    },
  ];

  // Execute the request.
  try {
    const batchUpdateResponse = Slides.Presentations.batchUpdate(
      {
        requests: requests,
      },
      presentationId,
    );
    console.log(
      "Refreshed a linked Sheets chart with ID: %s",
      presentationChartId,
    );

    return batchUpdateResponse;
  } catch (err) {
    // TODO (Developer) - Handle exception
    console.log("Failed with error: %s", err.error);
  }
}
Go
requests := []*slides.Request{{
	RefreshSheetsChart: &slides.RefreshSheetsChartRequest{
		ObjectId: presentationChartId,
	},
}}

// Execute the requests.
body := &slides.BatchUpdatePresentationRequest{Requests: requests}
response, _ := slidesService.Presentations.BatchUpdate(presentationId, body).Do()
fmt.Printf("Refreshed a linked Sheets chart with ID %s", presentationChartId)
Java
import com.google.api.client.googleapis.json.GoogleJsonError;
import com.google.api.client.googleapis.json.GoogleJsonResponseException;
import com.google.api.client.http.HttpRequestInitializer;
import com.google.api.client.http.javanet.NetHttpTransport;
import com.google.api.client.json.gson.GsonFactory;
import com.google.api.services.slides.v1.Slides;
import com.google.api.services.slides.v1.SlidesScopes;
import com.google.api.services.slides.v1.model.BatchUpdatePresentationRequest;
import com.google.api.services.slides.v1.model.BatchUpdatePresentationResponse;
import com.google.api.services.slides.v1.model.RefreshSheetsChartRequest;
import com.google.api.services.slides.v1.model.Request;
import com.google.auth.http.HttpCredentialsAdapter;
import com.google.auth.oauth2.GoogleCredentials;

import java.io.IOException;
import java.util.ArrayList;
import java.util.Collections;
import java.util.List;

/* Class to demonstrate the use of Slides Refresh Chart API */
public class RefreshSheetsChart {
  /**
   * Refresh the sheets charts.
   *
   * @param presentationId      - id of the presentation.
   * @param presentationChartId - id of the presentation chart.
   * @return presentation chart id
   * @throws IOException - if credentials file not found.
   */
  public static BatchUpdatePresentationResponse refreshSheetsChart(
      String presentationId, String presentationChartId) throws IOException {
        /* Load pre-authorized user credentials from the environment.
           TODO(developer) - See https://developers.google.com/identity for
            guides on implementing OAuth2 for your application. */
    GoogleCredentials credentials = GoogleCredentials.getApplicationDefault()
        .createScoped(Collections.singleton(SlidesScopes.PRESENTATIONS));
    HttpRequestInitializer requestInitializer = new HttpCredentialsAdapter(
        credentials);

    // Create the slides API client
    Slides service = new Slides.Builder(new NetHttpTransport(),
        GsonFactory.getDefaultInstance(),
        requestInitializer)
        .setApplicationName("Slides samples")
        .build();

    List<Request> requests = new ArrayList<>();

    // Refresh an existing linked Sheets chart embedded a presentation.
    requests.add(new Request()
        .setRefreshSheetsChart(new RefreshSheetsChartRequest()
            .setObjectId(presentationChartId)));

    BatchUpdatePresentationResponse response = null;
    try {
      // Execute the request.
      BatchUpdatePresentationRequest body =
          new BatchUpdatePresentationRequest().setRequests(requests);
      response = service.presentations().batchUpdate(presentationId, body).execute();
      System.out.println("Refreshed a linked Sheets chart with ID " + presentationChartId);
    } catch (GoogleJsonResponseException e) {
      // TODO(developer) - handle error appropriately
      GoogleJsonError error = e.getDetails();
      if (error.getCode() == 400) {
        System.out.printf("Presentation chart not found with id '%s'.\n", presentationChartId);
      } else if (error.getCode() == 404) {
        System.out.printf("Presentation not found with id '%s'.\n", presentationId);
      } else {
        throw e;
      }
    }
    return response;
  }
}
JavaScript
function refreshSheetsChart(presentationId, presentationChartId, callback) {
  const requests = [{
    refreshSheetsChart: {
      objectId: presentationChartId,
    },
  }];
  // Execute the request.
  try {
    gapi.client.slides.presentations.batchUpdate({
      presentationId: presentationId,
      requests: requests,
    }).then((batchUpdateResponse) => {
      console.log(`Refreshed a linked Sheets chart with ID: ${presentationChartId}`);
      if (callback) callback(batchUpdateResponse.result);
    });
  } catch (err) {
    document.getElementById('content').innerText = err.message;
    return;
  }
}
Node.js
import {GoogleAuth} from 'google-auth-library';
import {google} from 'googleapis';

/**
 * Refreshes an embedded Sheets chart in a presentation.
 * @param {string} presentationId The ID of the presentation.
 * @param {string} presentationChartId The ID of the chart to refresh.
 * @return {Promise<object>} The response from the batch update.
 */
async function refreshSheetsChart(presentationId, presentationChartId) {
  // Authenticate with Google and get an authorized client.
  const auth = new GoogleAuth({
    scopes: 'https://www.googleapis.com/auth/presentations',
  });

  // Create a new Slides API client.
  const service = google.slides({version: 'v1', auth});

  // The request to refresh the chart.
  const requests = [
    {
      refreshSheetsChart: {
        objectId: presentationChartId,
      },
    },
  ];

  // Execute the batch update request to refresh the chart.
  const batchUpdateResponse = await service.presentations.batchUpdate({
    presentationId,
    requestBody: {
      requests,
    },
  });
  console.log(
    `Refreshed a linked Sheets chart with ID: ${presentationChartId}`,
  );
  return batchUpdateResponse.data;
}
PHP
<?php
use Google\Client;
use Google\Service\Drive;
use Google\Service\Slides;
use Google\Service\Slides\BatchUpdatePresentationRequest;

function refreshSheetsChart($presentationId, $presentationChartId)
{
    /* Load pre-authorized user credentials from the environment.
       TODO(developer) - See https://developers.google.com/identity for
        guides on implementing OAuth2 for your application. */
    $client = new Google\Client();
    $client->useApplicationDefaultCredentials();
    $client->addScope(Google\Service\Drive::DRIVE);
    $slidesService = new Google_Service_Slides($client);
    try {

        $requests = array();
        $requests[] = new Google_Service_Slides_Request(array(
            'refreshSheetsChart' => array(
                'objectId' => $presentationChartId
            )
        ));

        // Execute the request.
        $batchUpdateRequest = new Google_Service_Slides_BatchUpdatePresentationRequest(array(
            'requests' => $requests
        ));
        $response = $slidesService->presentations->batchUpdate($presentationId, $batchUpdateRequest);
        printf("Refreshed a linked Sheets chart with ID: %s\n", $response->getPresentationId());
        return $response;
    } catch (Exception $e) {
        echo 'Message: ' . $e->getMessage();
    }
}
Python
import google.auth
from googleapiclient.discovery import build
from googleapiclient.errors import HttpError


def refresh_sheets_chart(presentation_id, presentation_chart_id):
  """
  refresh_sheets_chart the user has access to.
  Load pre-authorized user credentials from the environment.
  TODO(developer) - See https://developers.google.com/identity
  for guides on implementing OAuth2 for the application.
  """
  creds, _ = google.auth.default()
  # pylint: disable=maybe-no-member
  try:
    slides_service = build("slides", "v1", credentials=creds)
    # Refresh an existing linked Sheets chart embedded in a presentation.
    requests = [{"refreshSheetsChart": {"objectId": presentation_chart_id}}]

    # Execute the request.
    body = {"requests": requests}
    response = (
        slides_service.presentations()
        .batchUpdate(presentationId=presentation_id, body=body)
        .execute()
    )
    print(f"Refreshed a linked Sheets chart with ID:{presentation_chart_id}")
    return response
  except HttpError as error:
    print(f"An error occurred: {error}")
    return error


if __name__ == "__main__":
  # Put the presentation_id, presentation_chart_id
  # to be submitted.
  refresh_sheets_chart(
      "10QnVUx1X2qHsL17WUidGpPh_SQhXYx40CgIxaKk8jU4", "1107320627"
  )
Ruby
# Refresh an existing linked Sheets chart embedded in a presentation.
requests = [{
  refresh_sheets_chart: {
    object_id_prop: presentation_chart_id
  }
}]

# Execute the request.
req = Google::Apis::SlidesV1::BatchUpdatePresentationRequest.new(requests: requests)
response = slides_service.batch_update_presentation(presentation_id, req)

puts "Refreshed a linked Sheets chart with ID: #{presentation_chart_id}"