Page Summary
-
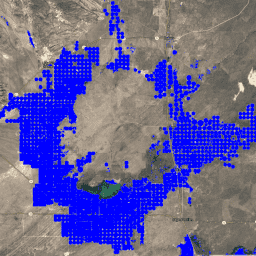
This dataset provides an annual classification of irrigation status at a 30m resolution for the 11 Western United States from 1986 to 2018.
-
The classification is based on the Random Forest algorithm using Landsat data and is converted to a binary classification of irrigated and non-irrigated.
-
The dataset has been superseded by a newer version: UMT/Climate/IrrMapper_RF/v1_2.
-
Irrigated pixels in this dataset have a value of 1, while other pixels are masked out.
-
The dataset is available under the CC-BY-4.0 license.
- Dataset Availability
- 1986-01-01T00:00:00Z–2018-01-01T00:00:00Z
- Dataset Producer
- University of Montana / Montana Climate Office
- Tags
Description
IrrMapper is an annual classification of irrigation status in the 11 Western United States made at Landsat scale (i.e., 30 m) using the Random Forest algorithm, covering years 1986 - present.
While the IrrMapper paper describes classification of four classes (i.e., irrigated, dryland, uncultivated, wetland), the dataset is converted to a binary classification of irrigated and non-irrigated.
'Irrigated' refers to the detection of any irrigation during the year. The IrrMapper random forest model was trained using an extensive geospatial database of land cover from each of four irrigated- and non-irrigated classes, including over 50,000 human-verified irrigated fields, 38,000 dryland fields, and over 500,000 square kilometers of uncultivated lands.
For version 1.1, the original training data was re-run on Landsat Collection 2 and brought up-to-date.
Bands
Pixel Size
30 meters
Bands
| Name | Pixel Size | Description |
|---|---|---|
classification |
meters | Irrigated pixels have the value of 1, the other pixels are masked out. |
Terms of Use
Terms of Use
Citations
Ketchum, D.; Jencso, K.; Maneta, M.P.; Melton, F.; Jones, M.O.; Huntington, J. IrrMapper: A Machine Learning Approach for High Resolution Mapping of Irrigated Agriculture Across the Western U.S., Remote Sens. 2020, 12, 2328. doi:10.3390/rs12142328
Explore with Earth Engine
Code Editor (JavaScript)
var dataset = ee.ImageCollection('UMT/Climate/IrrMapper_RF/v1_1');
var irr = dataset.filterDate('2018-01-01', '2018-12-31').mosaic();
var irr = irr.mask(irr.eq(1));

var visualization = {
  min: 0.0,
  max: 1.0,
  palette: ['blue']
};
Map.addLayer(irr, visualization, 'IrrMapper 2018');
Map.setCenter(-112.516, 45.262, 10);