Page Summary
-
This dataset, which provides VIIRS vegetation indices at 500m resolution every 16 days, has been superseded by NASA/VIIRS/002/VNP13A1.
-
The data includes three vegetation indices: NDVI, EVI, and EVI2, along with other reflectance and quality layers.
-
The dataset is available from 2012-01-17 to 2024-05-24 and is provided by NASA LP DAAC.
- Dataset Availability
- 2012-01-17T00:00:00Z–2024-05-24T00:00:00Z
- Dataset Producer
- NASA LP DAAC at the USGS EROS Center
- Cadence
- 8 Days
- Tags
Description
The Suomi National Polar-Orbiting Partnership (S-NPP) NASA Visible Infrared Imaging Radiometer Suite (VIIRS) Vegetation Indices (VNP13A1) data product provides vegetation indices by a process of selecting the best available pixel over a 16-day acquisition period at 500 meter resolution. The VNP13 data products are designed after the Moderate Resolution Imaging Spectroradiometer (MODIS) Terra and Aqua Vegetation Indices product suite to promote the continuity of the Earth Observation System (EOS) mission.
The VNP13 algorithm process produces three vegetation indices: (1) Normalized Difference Vegetation Index (NDVI), (2) the Enhanced Vegetation Index (EVI), and (3) Enhanced Vegetation Index-2 (EVI2). (1) NDVI is one of the longest continual remotely sensed time series observations, using both the red and near-infrared (NIR) bands. (2) EVI is a slightly different vegetation index that is more sensitive to canopy cover, while NDVI is more sensitive to chlorophyll. (3) EVI2 is a reformation of the standard 3-band EVI, using the red band and NIR band. This reformation addresses arising issues when comparing VIIRS EVI to other EVI models that do not include a blue band. EVI2 will eventually become the standard EVI.
Along with the three Vegetation Indices layers, this product also includes layers for near-infrared (NIR) reflectance; three shortwave infrared (SWIR) reflectance-red, blue, and green reflectance; composite day of year; pixel reliability; view and sun angles, and a quality layer.
For additional information, visit the VIIRS Land Product Quality Assessment website and see the User Guide.
Documentation:
Bands
Pixel Size
500 meters
Bands
| Name | Units | Scale | Pixel Size | Wavelength | Description | ||||||||||||||||||||||||||||||||||||||||||||||||||||||||||||||||||||||||||||||||||||||||||||||
|---|---|---|---|---|---|---|---|---|---|---|---|---|---|---|---|---|---|---|---|---|---|---|---|---|---|---|---|---|---|---|---|---|---|---|---|---|---|---|---|---|---|---|---|---|---|---|---|---|---|---|---|---|---|---|---|---|---|---|---|---|---|---|---|---|---|---|---|---|---|---|---|---|---|---|---|---|---|---|---|---|---|---|---|---|---|---|---|---|---|---|---|---|---|---|---|---|---|---|---|
EVI |
0.0001 | meters | None | 3 band Enhanced Vegetation Index |
|||||||||||||||||||||||||||||||||||||||||||||||||||||||||||||||||||||||||||||||||||||||||||||||
EVI2 |
0.0001 | meters | None | 2 band Enhanced Vegetation Index |
|||||||||||||||||||||||||||||||||||||||||||||||||||||||||||||||||||||||||||||||||||||||||||||||
NDVI |
0.0001 | meters | None | Normalized Difference Vegetation Index |
|||||||||||||||||||||||||||||||||||||||||||||||||||||||||||||||||||||||||||||||||||||||||||||||
NIR_reflectance |
meters | 846-885nm | Near-infrared Radiation reflectance |
||||||||||||||||||||||||||||||||||||||||||||||||||||||||||||||||||||||||||||||||||||||||||||||||
SWIR1_reflectance |
meters | 1230-1250nm | Shortwave Infrared Radiation reflectance |
||||||||||||||||||||||||||||||||||||||||||||||||||||||||||||||||||||||||||||||||||||||||||||||||
SWIR2_reflectance |
meters | 1580-1640nm | Shortwave Infrared Radiation reflectance |
||||||||||||||||||||||||||||||||||||||||||||||||||||||||||||||||||||||||||||||||||||||||||||||||
SWIR3_reflectance |
meters | 2225-2275nm | Shortwave Infrared Radiation reflectance |
||||||||||||||||||||||||||||||||||||||||||||||||||||||||||||||||||||||||||||||||||||||||||||||||
VI_Quality |
meters | None | Quality Assessment (QA) bit-field. |
||||||||||||||||||||||||||||||||||||||||||||||||||||||||||||||||||||||||||||||||||||||||||||||||
red_reflectance |
meters | 600-680nm | Red band reflectance |
||||||||||||||||||||||||||||||||||||||||||||||||||||||||||||||||||||||||||||||||||||||||||||||||
green_reflectance |
meters | 545-656nm | Green band reflectance |
||||||||||||||||||||||||||||||||||||||||||||||||||||||||||||||||||||||||||||||||||||||||||||||||
blue_reflectance |
meters | 478-498nm | Blue band reflectance |
||||||||||||||||||||||||||||||||||||||||||||||||||||||||||||||||||||||||||||||||||||||||||||||||
composite_day_of_the_year |
d | meters | None | Julian day of year |
|||||||||||||||||||||||||||||||||||||||||||||||||||||||||||||||||||||||||||||||||||||||||||||||
pixel_reliability |
meters | None | Pixel usefulness using a simple rank class |
||||||||||||||||||||||||||||||||||||||||||||||||||||||||||||||||||||||||||||||||||||||||||||||||
relative_azimuth_angle |
deg | meters | None | Relative azimuth angle for each pixel |
|||||||||||||||||||||||||||||||||||||||||||||||||||||||||||||||||||||||||||||||||||||||||||||||
sun_zenith_angle |
deg | meters | None | Sun zenith angle for each pixel |
|||||||||||||||||||||||||||||||||||||||||||||||||||||||||||||||||||||||||||||||||||||||||||||||
view_zenith_angle |
deg | meters | None | View zenith angle for each pixel |
|||||||||||||||||||||||||||||||||||||||||||||||||||||||||||||||||||||||||||||||||||||||||||||||
pixel_reliability Class Table
| Value | Color | Description |
|---|---|---|
| 0 | None | Excellent |
| 1 | None | Good |
| 2 | None | Acceptable |
| 3 | None | Marginal |
| 4 | None | Pass |
| 5 | None | Questionable |
| 6 | None | Poor |
| 7 | None | Cloud Shadow |
| 8 | None | Snow/Ice |
| 9 | None | Cloud |
| 10 | None | Estimated |
| 11 | None | LTAVG (taken from database) |
Terms of Use
Terms of Use
LP DAAC NASA data are freely accessible; however, when an author publishes these data or works based on the data, it is requested that the author cite the datasets within the text of the publication and include a reference to them in the reference list.
Citations
Please visit LP DAAC 'Citing Our Data' page for information on citing LP DAAC datasets.
DOIs
Explore with Earth Engine
Code Editor (JavaScript)
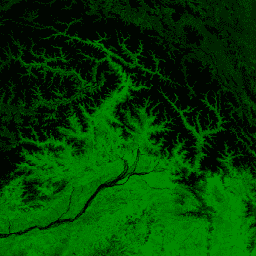
var dataset = ee.ImageCollection('NOAA/VIIRS/001/VNP13A1');
var mean_evi_january_2018 = dataset
    .filterDate('2018-01-01', '2018-01-31')
    .select('EVI')
    .mean();
var evi_vis = {
  min: 0,
  max: 10000,
  palette: ['000000', '004400', '008800', '00bb00', '00ff00'],
};
Map.setCenter(95.571, 27.808, 8);
Map.addLayer(mean_evi_january_2018, evi_vis, 'Mean EVI January 2018');