Page Summary
-
This dataset contains ALOS-2 PALSAR-2 Level 2.1 strip map mode observation data from JAXA, made available for public and research use, particularly for disaster management.
-
The data covers dates from 2022-09-26 to 2024-01-08 and includes emergency observations from January 1-3 and January 8, 2024, with some archive data.
-
PALSAR-2 Level 2.1 data is orthorectified and the DN values can be converted to sigma naught values in decibel unit using a specified equation.
-
The dataset includes a single band (
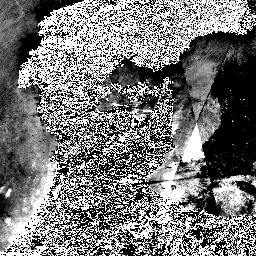
b1) representing the HH polarization Terrain-flattened Gamma-Nought backscatter coefficient with a pixel size of 3 meters. -
This data is available for non-commercial use free of charge, subject to the JAXA G-Portal Terms of service.
- Dataset Availability
- 2022-09-26T00:00:00Z–2024-01-08T00:00:00Z
- Dataset Producer
- JAXA EORC
- Tags
Description
Starting from the night of January 1st, 2024, based on the request from Japanese ministries and related organization, JAXA implemented ALOS-2 PALSAR-2 emergency observation. Since JAXA expects these emergency observation data to be extremely useful for disaster management, JAXA decided to open these data on Google Earth Engine for public and research usage.
JAXA released PALSAR-2 Level 2.1 strip map mode observation data with 3m single polarization for January 1-3 and January 8 2024, together with some archive data. PALSAR-2 Level 2.1 data is orthorectified from level 1.1 data by using digital elevation model. The DN values can be converted to sigma naught values in decibel unit (dB) using the following equation:
- σ0 = 10*log10(DN2) - 83.0 dB
Below are the dates for which the dataset has data.
| Obs date | Frame | Beam | A/D |
|---|---|---|---|
| 2024/01/01 and 2022/09/26 | 0750, 0760, 0770 | U2-6L | Asc. |
| 2024/01/02 and 2023/06/06 | 2820, 2830, 2840 | U2-8L | Desc. |
| 2024/01/08, 2024/01/03 and 2023/12/06 | 0720, 0730 | U2-9R | Asc. |
Bands
Bands
Pixel size: 3 meters (all bands)
| Name | Pixel Size | Description |
|---|---|---|
b1 |
3 meters | HH polarization Terrain-flattened Gamma-Nought backscatter coefficient. |
Terms of Use
Terms of Use
Anyone can use this data free of charge subject to non-commercial use only. For detailed terms of use see JAXA G-Portal Terms of service (Section 7. Condition concerning of G-Portal data).
Citations
The data used for this paper have been provided by Earth Observation Research Center (EORC) of Japan Aerospace Exploration Agency (JAXA).
Explore with Earth Engine
Code Editor (JavaScript)
var coll = ee.ImageCollection('JAXA/ALOS/PALSAR-2/Level2_1/StripMap_202401');

var vis = {min: 0, max: 8000};

// Visualize different date ranges
var visualizeDateRange = function(startDate, endDate, layerName) {
  var dateRange = coll.filterDate(startDate, endDate);
  Map.addLayer(dateRange, vis, layerName);
};

visualizeDateRange('2023-06-06', '2023-06-07', 'Before-2023-06-06');
visualizeDateRange('2023-06-12', '2023-06-13', 'Before-2023-06-12');
visualizeDateRange('2022-09-26', '2022-09-27', 'Before-2022-09-26');
visualizeDateRange('2023-12-06', '2023-12-07', 'Before-2023-12-06');
visualizeDateRange('2024-01-01', '2024-01-02', 'After-2024-01-01');
visualizeDateRange('2024-01-02', '2024-01-03', 'After-2024-01-02');
visualizeDateRange('2024-01-03', '2024-01-04', 'After-2024-01-03');
visualizeDateRange('2024-01-08', '2024-01-09', 'After-2024-01-08');

Map.setCenter(137.2228, 37.1204, 8);