Page Summary
-
The Google Mobile Ads C++ SDK is deprecated and will reach End-of-Maintenance on June 17, 2025.
-
Ad inspector is a tool included with Google Mobile Ads SDK version 9.1.0 and higher for analyzing test ad requests in real-time.
-
To use ad inspector, you need an AdMob account, a set up app, SDK version 9.1.0+, and a registered test device.
-
Ad inspector can be launched using gestures, programmatically, or from the debug menu.
-
Ad inspector allows you to view and troubleshoot mediation waterfall and bidding details for ad units, as well as view available adapters.
-
You can test ad units and perform single ad source tests directly within ad inspector.
-
Ad inspector supports viewing and debugging privacy signals passed in ad requests for SDK version 9.6.0 or higher.
This guide demonstrates how to launch and use the different features in ad inspector.
Prerequisites
In order to use ad inspector, you need to:
- Complete the Get Started guide.
- Use Google Mobile Ads SDK version 9.1.0 or higher.
- Add your device as a test device. Ad inspector only launches on test devices.
Launch ad inspector
Ad inspector can be launched from anywhere in your app in the following ways:
- Use the gesture selected in the AdMob UI when registering a test device.
- Programmatically using the provided API.
- Use the launch button from the debug menu.
Launch using gestures
No changes are needed to your app to launch ad inspector with a gesture; just perform the gesture (double flick or shake) that you configured in AdMob for that test device. Learn more
After setting a gesture in the AdMob UI (and waiting 15 minutes for it to propagate), your app needs to make an ad request for the Google Mobile Ads SDK to learn about your gesture setting. If your specified gesture isn't working, try loading an ad, restarting your app, and testing the gesture again.
Launch programmatically
Ad inspector can also be launched programmatically:
This API works for test devices registered programmatically or in the AdMob UI.
View and troubleshoot ad units
Once launched, the main ad inspector screen appears, containing a list of all ad units in the AdMob UI associated with your AdMob app ID that have bidding or mediation configurations:
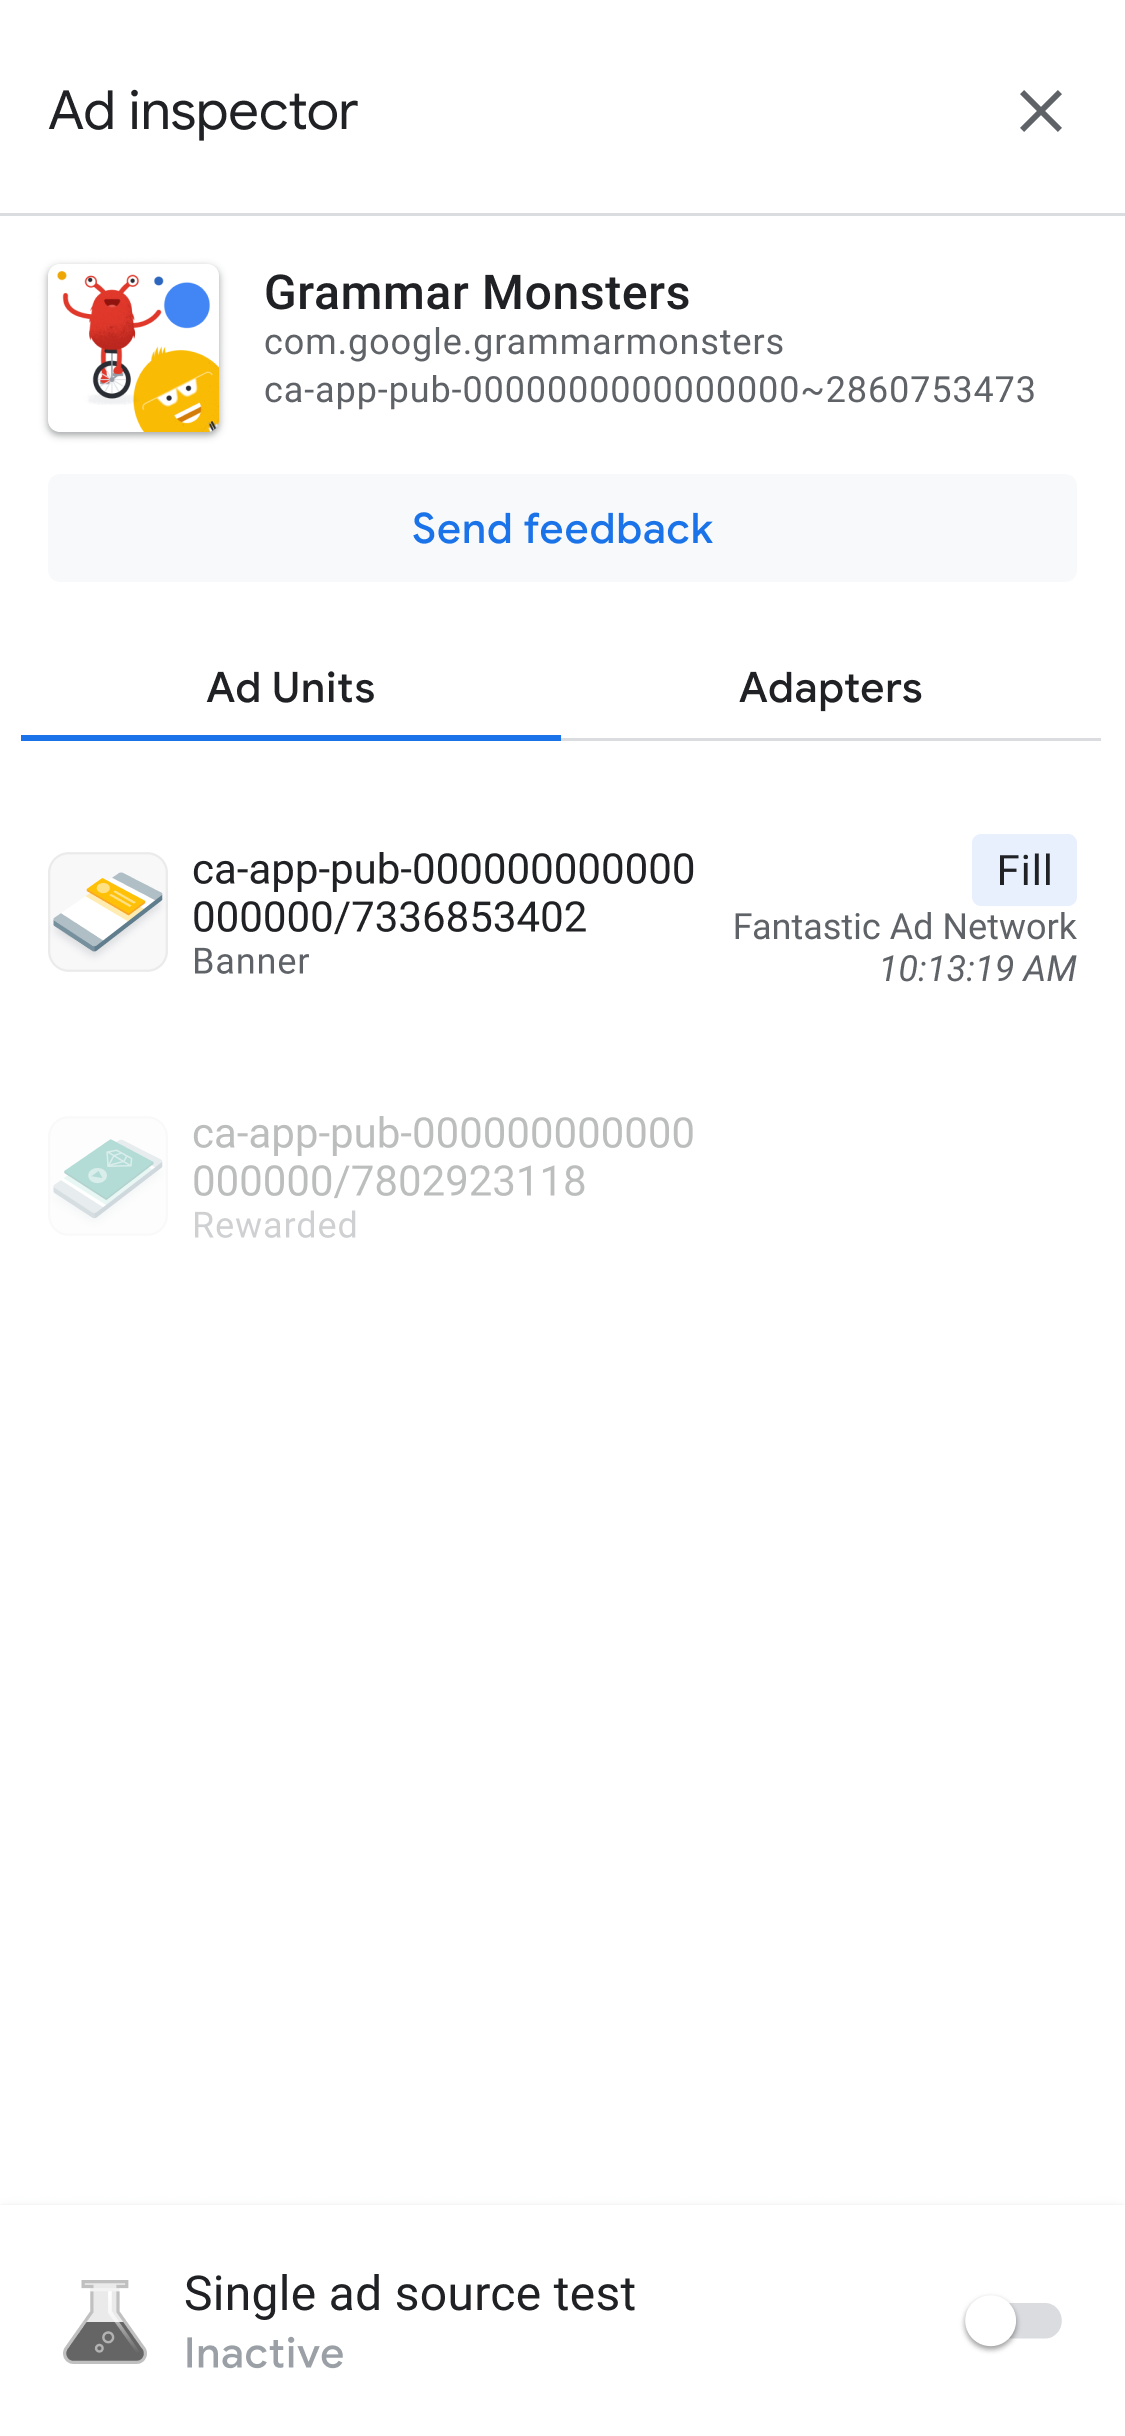
We recommend initializing the Google Mobile Ads SDK before using ad inspector.
View mediation waterfall details for an ad unit
Tap an ad unit to view its SDK request log, which gives details about the mediation waterfall up to the point when the ad was filled (or the waterfall ended without a fill) for the latest ad requests.
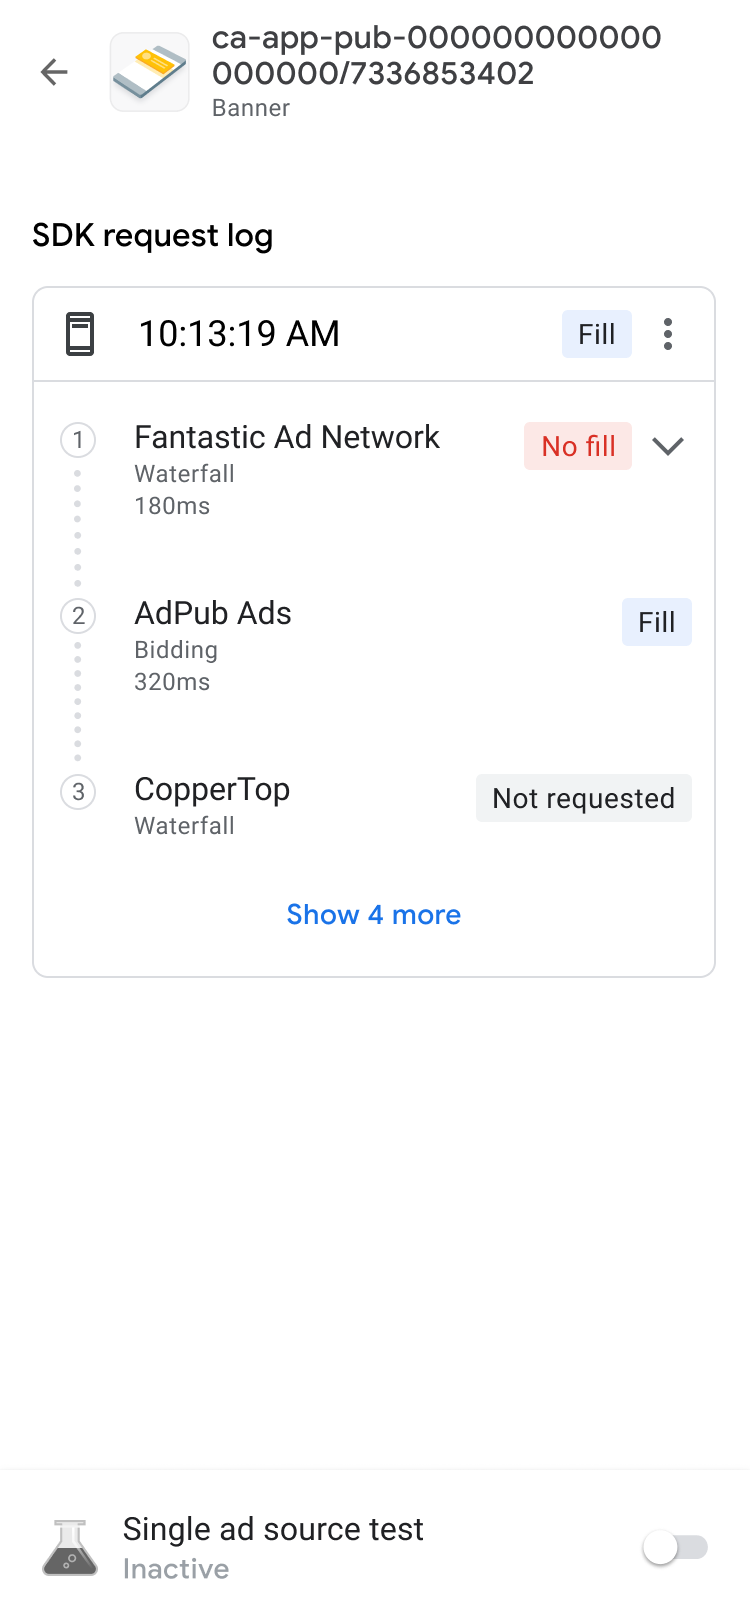
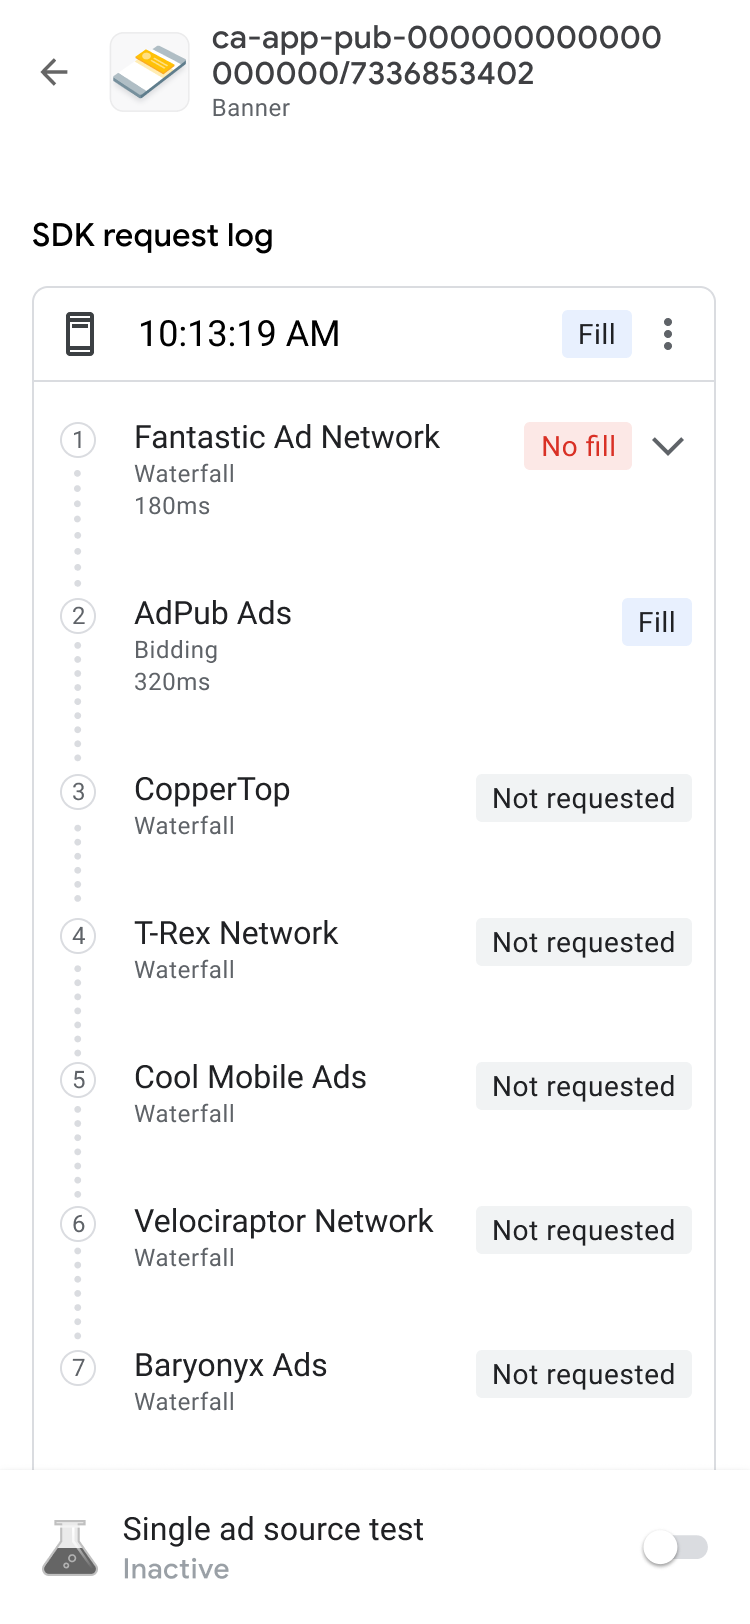
Each request can be expanded using the disclosure indicator to show the results of the mediation waterfall for that request, along with any error and latency that was applicable for that request.
For third-party ad sources, the error messages are sent directly from the ad source. If you need more information, consult your third-party ad source.
View bidding details for an ad unit
If you are new to bidding, read the overview.
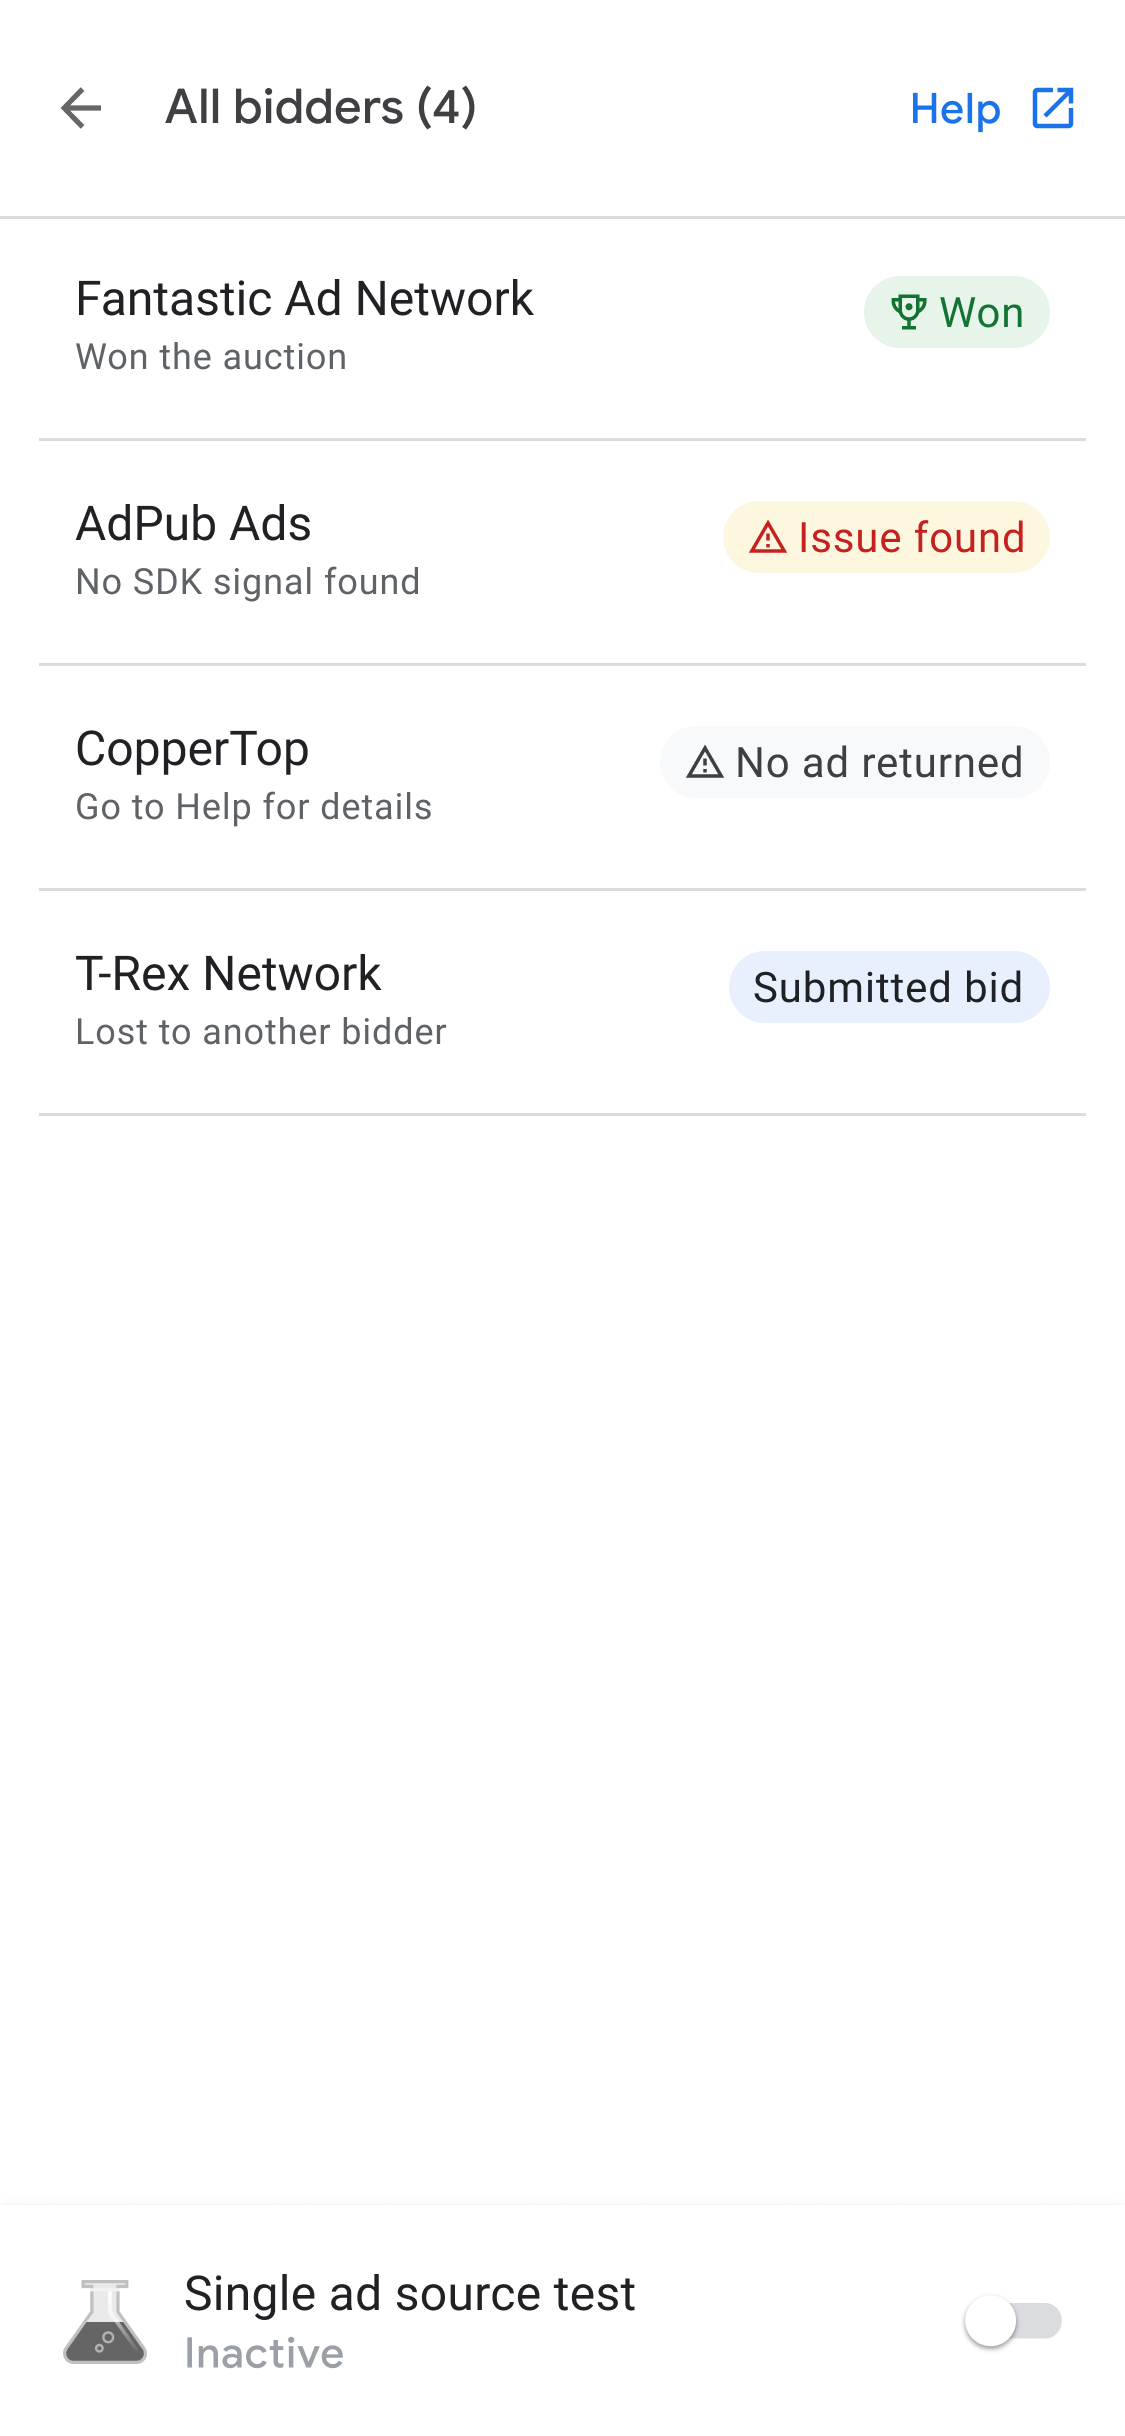
In the SDK request log, you can see the bidding ad sources that are called in the ad request. Tap an ad unit in the SDK request log to view the details of each ad source in the bidding auction.
The bidding results are sorted in order to bring the actionable items closer to the top of the list:
At the top is the ad network that won the auction.
Next are the ad networks with issues. You can follow the troubleshooting steps for the issues.
Then, there are the ad networks that had no ads returned or did not bid. This is a possible indicator of many different issues with the ad source as it might not have bid due to its setup or decisioning. You can refer to the ad source's setup guide or contact the ad source directly for support.
Finally, at the bottom of the list are the ad networks that lost the bidding auction.
Mediation waterfall can place the ad source that won the bidding auction according to their eCPM value.
When an ad source is called in the mediation waterfall, it is able to serve ads. To learn more about how bidding works with mediation waterfall, see example 2 and example 3 of bidding and waterfall ad sources in a mediation group.
Advanced ad unit debugging
When troubleshooting ad units, it can be helpful to dig into the ad request and response to identify where something is failing, or to share with Google Support to aid in debugging. Tap the menu icon at the top of the waterfall chain and select Share ad request and response to export the full ad request and response. This saves you the trouble of having to run network traces on your own app.
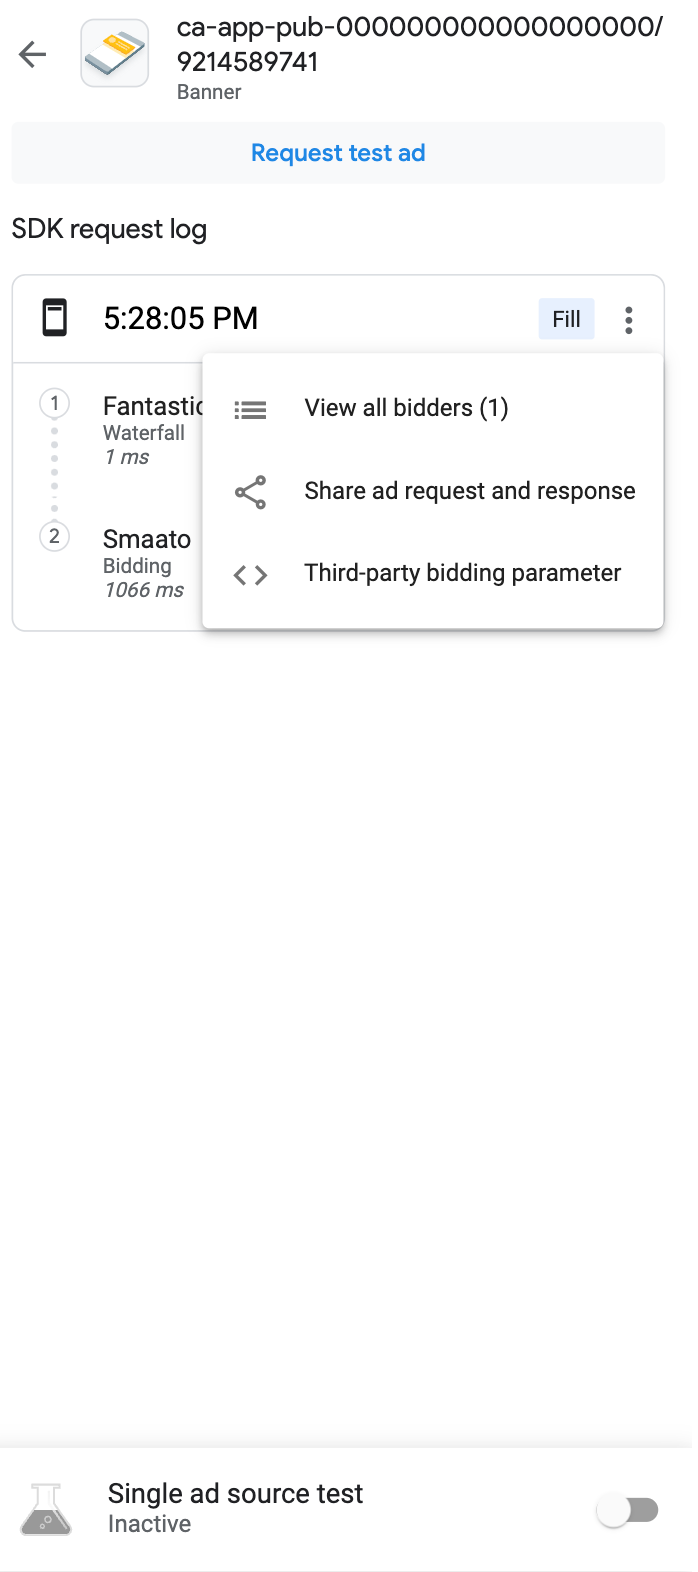
Additionally, you can view decoded third-party bidding parameters by tapping the Third-party bidding parameter option on the same menu as the request string. This provides details about which third-party bidding parameters might be having issues, helping you to debug your app or validate that a network is collecting its signals successfully.

View available adapters
Click the Adapters tab to see a list of all third-party adapters associated with the ad sources in the bidding or mediation configurations in your app. Then, expand cards to view their initialization statuses and SDK versions. Along with supported third-party adapters, you can also view custom event adapters.
Custom events let publishers use ad networks that AdMob doesn't support. Custom events are distinguishable from standard third-party adapters in the adapter list by their unique class names. In addition to providing class name and status information, ad inspector also displays the labels assigned to those custom events in the AdMob web interface.
In the event the adapter isn't found or fails to initialize, see Troubleshoot issues found using ad inspector for more information.

Test your ad units
If you'd like to test your ad unit without having to navigate to it in your app's UI, ad inspector supports this directly from the ad unit detail screen. Additionally, you're able to test multiple ad units at once, asynchronously load and view your test ad requests, and even perform single ad source tests.
Ad testing
The ad inspector ad tests outlined in this section are a great tool for verifying your base ad experience and for validating your mediation configuration when used with single ad source testing.
When you're ready to test your ad unit, tap the Request test ad button at the top of your ad inspector screen to trigger your ad inspector ad test. Test results then appear in the SDK request log underneath the header Requested from ad inspector.
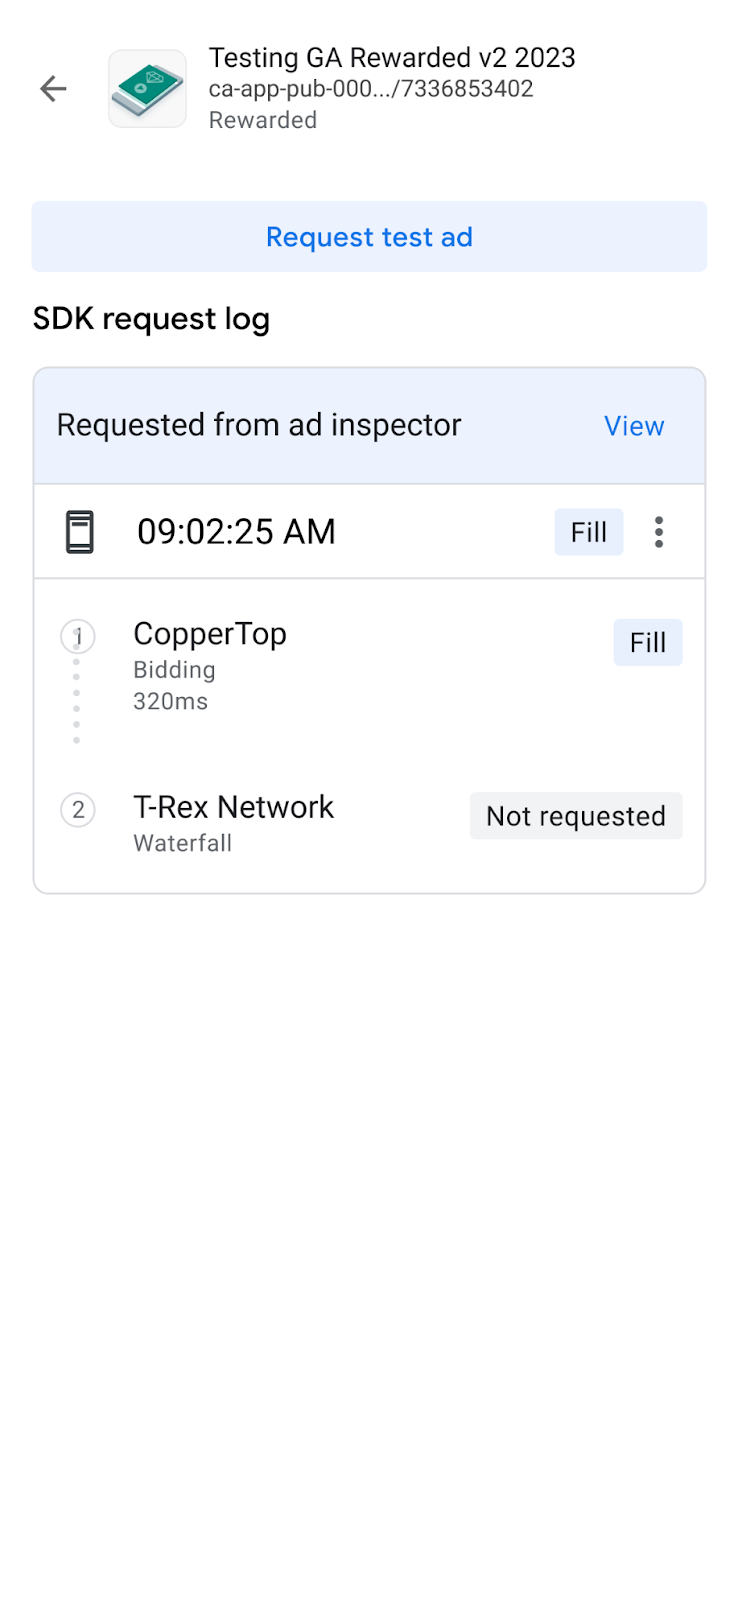
Single ad source testing
Ad inspector has a feature to restrict ad requests in your app to only serve ads from a single bidding or waterfall mediation ad source. This lets you verify that you've correctly implemented the third-party adapter and that the ad source is serving as expected.
To enable this feature, toggle the Single ad source test switch at the bottom of the screen. This displays the following ad source selection dialog:

You must initialize the Google Mobile Ads SDK before you can use single ad source testing.
You can then select a single ad source to test. Once an ad source is selected, the following screen appears:
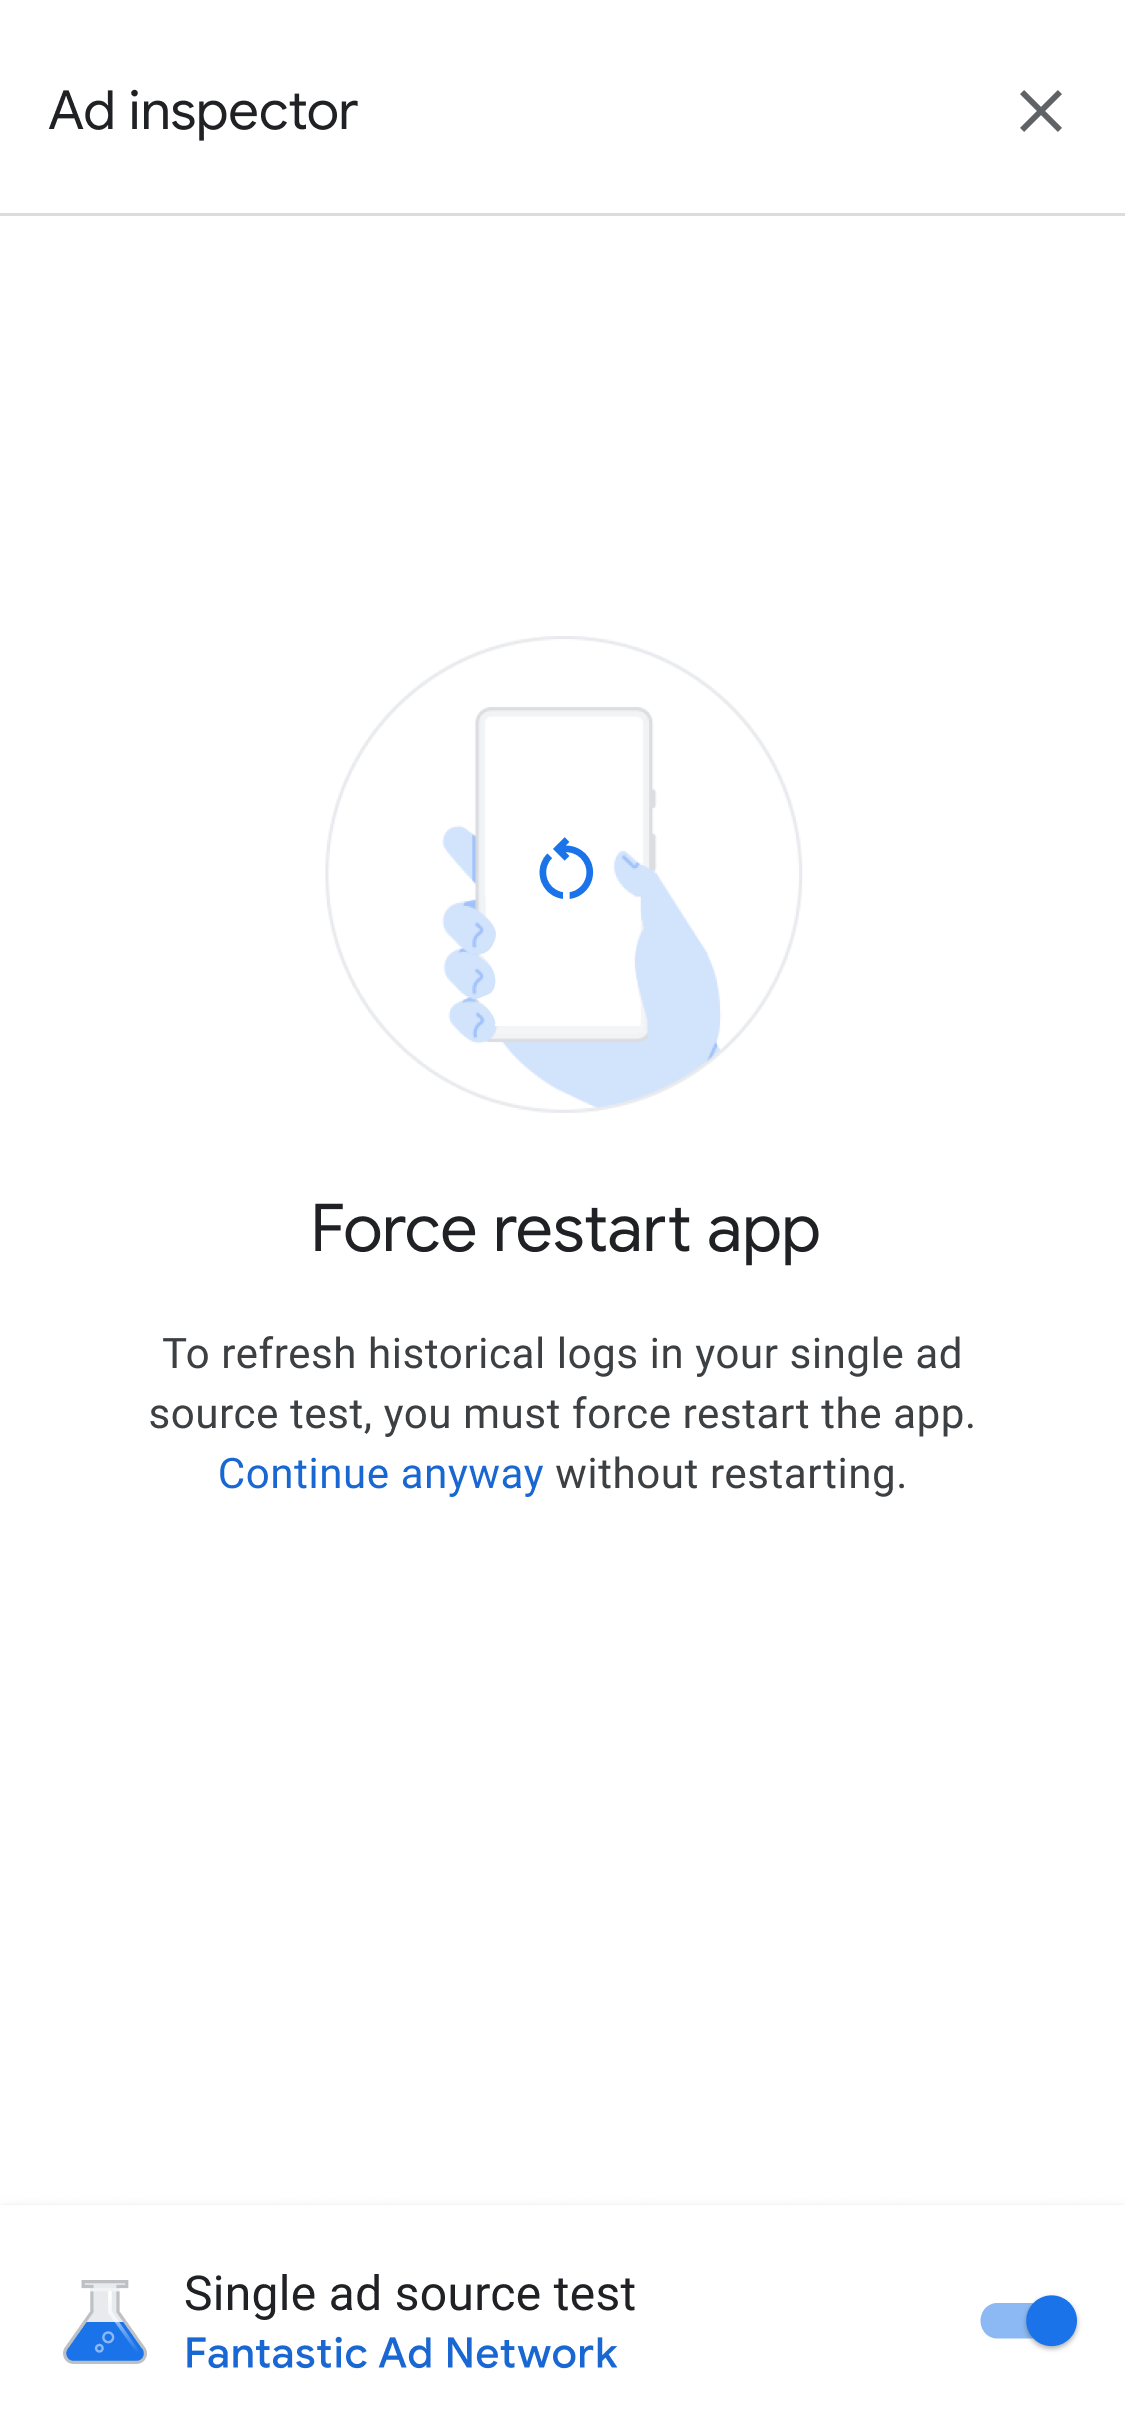
The single ad source test setting applies to any future ad requests you make in the same session. However, it doesn't apply to any previously cached ads in that session that have not yet been shown. Force restarting your app is recommended when applying a single ad source test in order to invalidate any cached ads that could be served instead of your chosen ad source receiving a request.
After restarting your app, all ad unit placements attempt to show an ad from the selected network only. Launching ad inspector when a single ad source test is active shows the active test ad source:
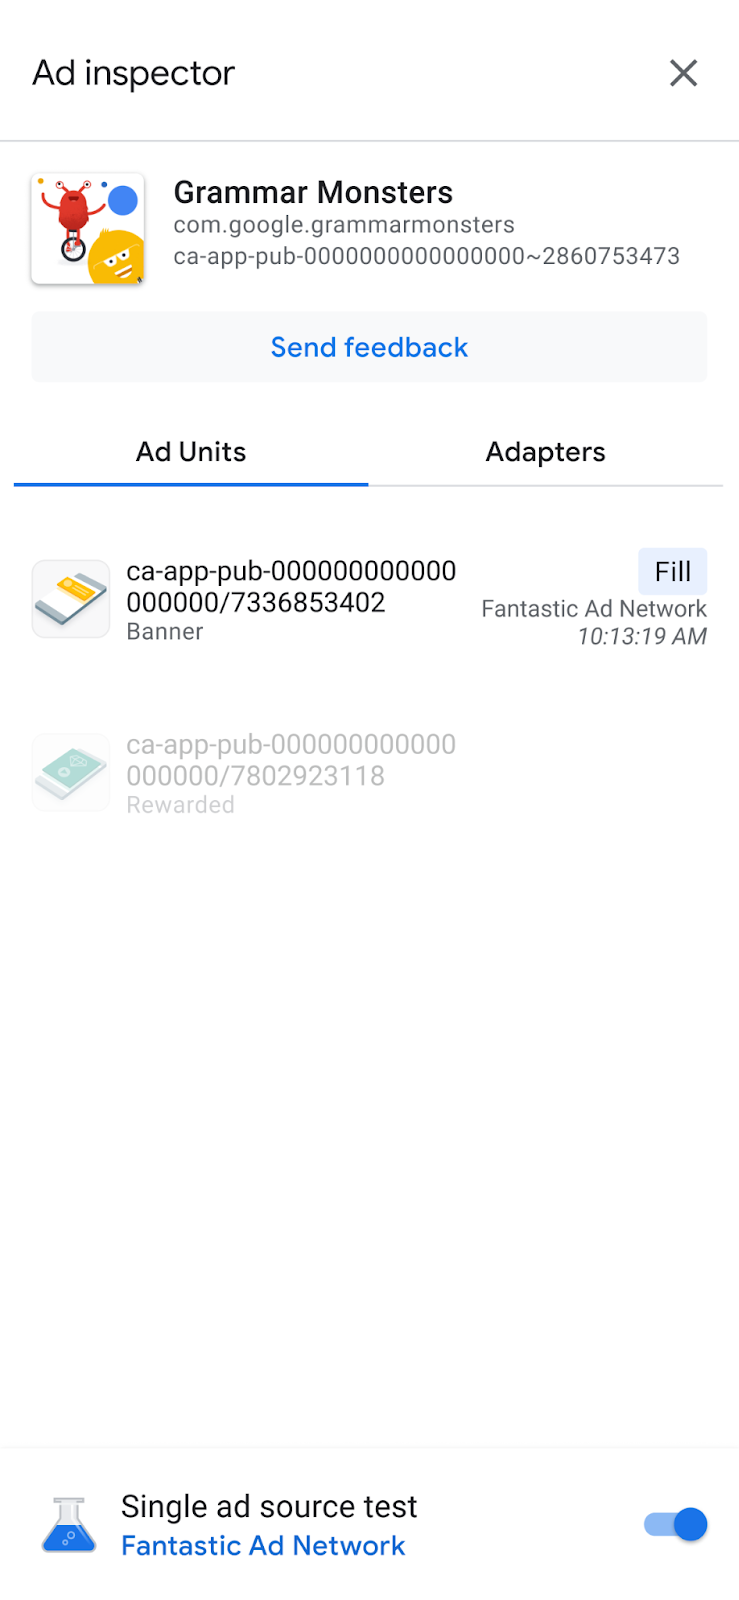
In single ad source test mode, all ad requests attempt to fill with the selected ad source, regardless of whether that ad source was configured for bidding or mediation for the requested ad unit. If the ad source you're testing is not in the mediation waterfall for an ad unit, you get a "No fill" error message.
In a single ad source test, you can tap an ad unit to view its SDK request log. This lets you know whether the ad source filled the ad requests made after single ad source testing is enabled. If the ad source failed to load an ad, an error message appears describing the error.
If you've added multiple instances of the selected ad source to a mediation waterfall, you would see each instance of the call to the ad source in the waterfall until the ad is either filled or the waterfall ended without a fill.
Stop a single ad source test
To stop the test, toggle off the switch:
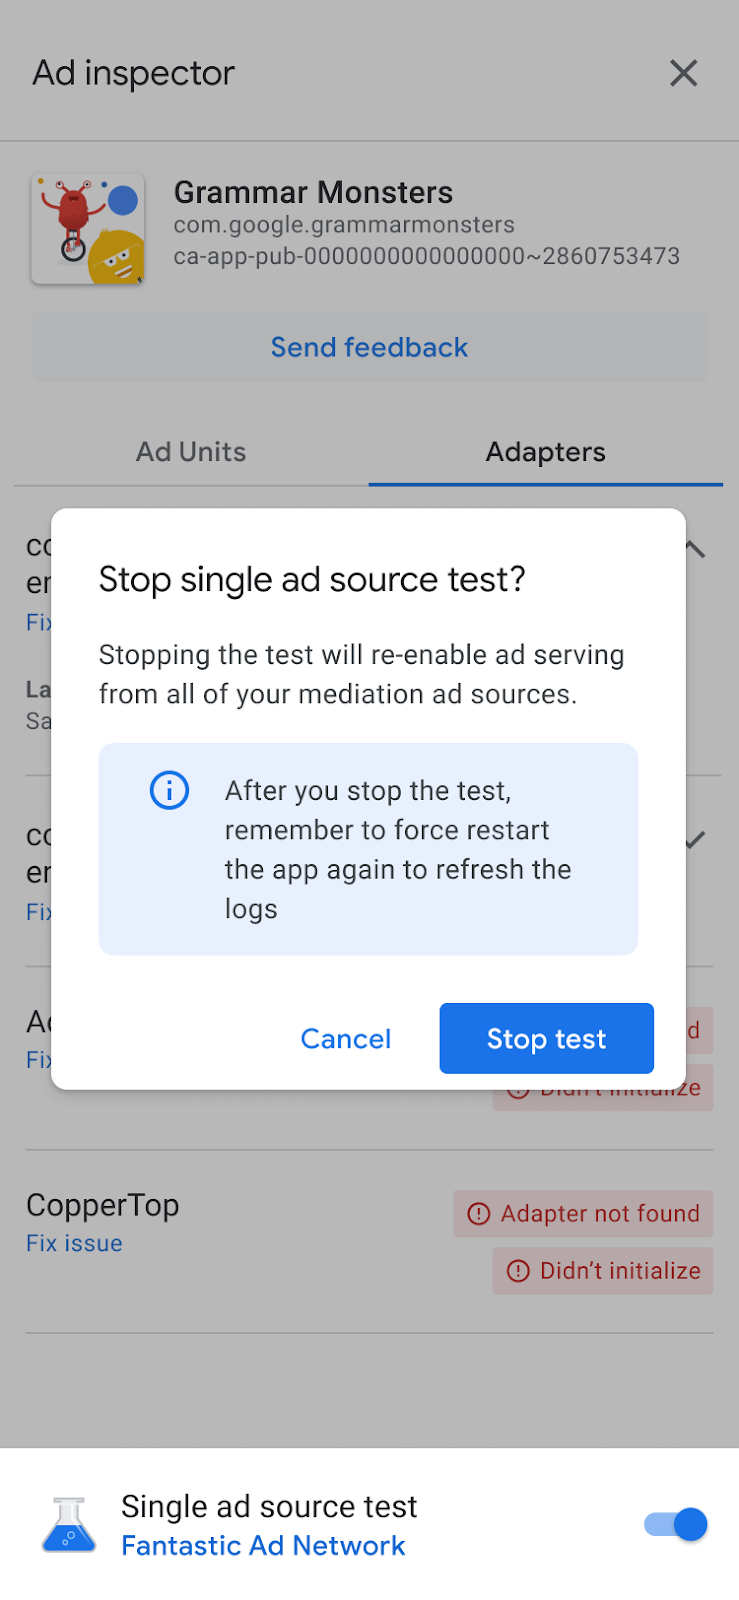
A confirmation message then appears over the following restart screen:
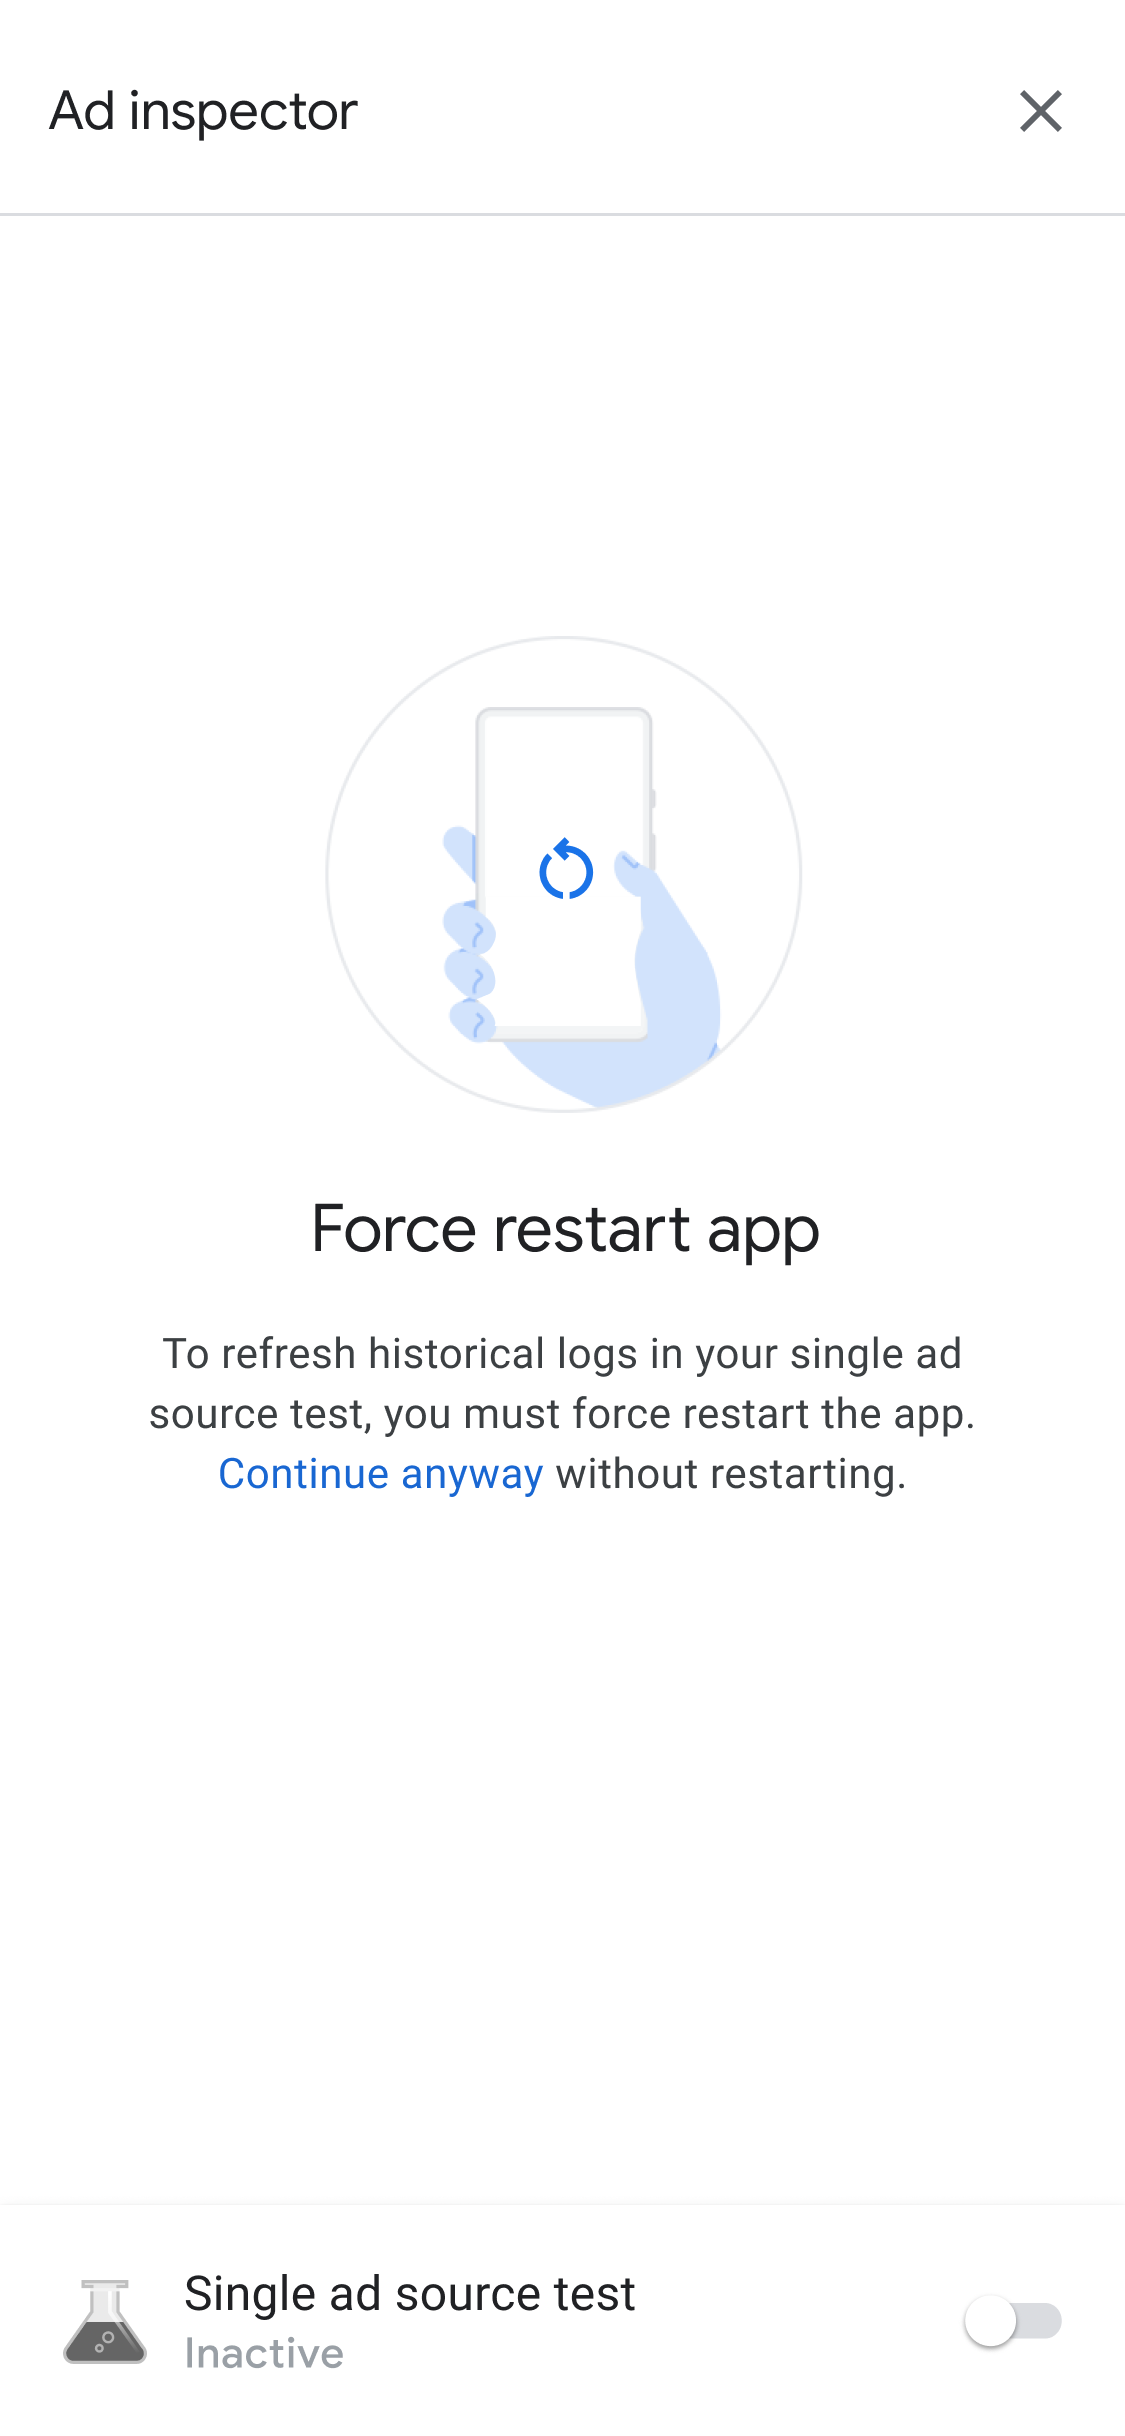
We recommend a force restart of your app after stopping the test in order to invalidate any cached ads for the ad source that was tested.
Debug privacy settings
Prerequisites: Google Mobile Ads SDK version 9.6.0 or higher
You can use ad inspector to view the following privacy signals passed in the ad request as part of Publisher integration with the IAB Europe TCF:
- GDPR applies (
IABTCF_gdprApplies) - AC string (
IABTCF_AddtlConsent) - TC string (
IABTCF_TCString)
After loading an ad or performing ad testing in ad inspector, tap the menu icon on the request under SDK request log. Next, select the Privacy signals option.

The Privacy signals screen displays the privacy signals passed in the ad request.
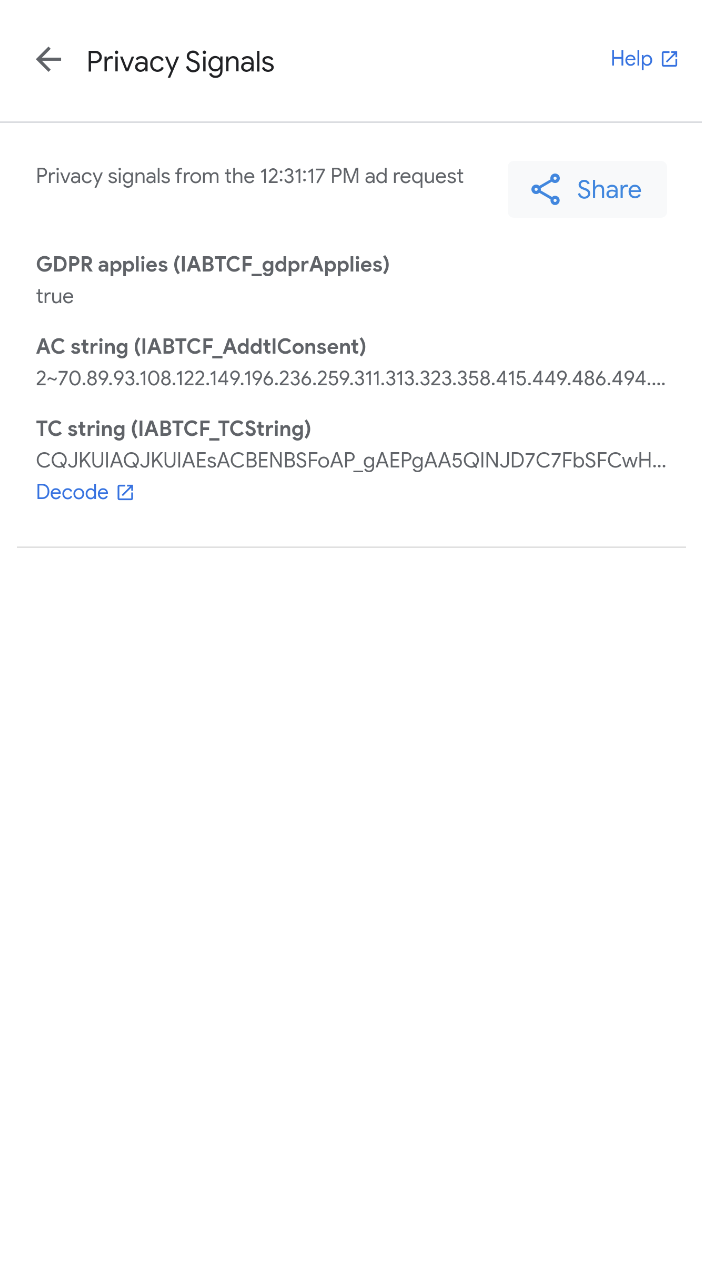
To learn more about the AC string, see Google's Additional Consent technical specification. To view granular consent details in the TC string, such as the CMP ID and the list of consented vendor identifiers associated with IAB, click Decode to open the IAB GPP Encoder / Decoder.
If you encounter any errors, follow the steps in Understand privacy issues to troubleshoot.
Copy entire debugging outputs
The ad inspector supports copying a JSON string containing entire debugging outputs from the tool, including details of your AdMob app, adapter initialization statuses, and the testing results of all ad units.
To do so, tap the app icon seven times until you see the message Copied ad inspector JSON to clipboard.