Page Summary
-
KML Regions control the visibility and loading of data in Google Earth based on user viewpoint and zoom level.
-
Super-Overlays utilize Regions and NetworkLinks to efficiently display large images by loading only the necessary tiles at appropriate resolutions.
-
Regions are defined by geographic boundaries and Level of Detail (LOD) settings, ensuring data is loaded only when needed.
-
NetworkLinks with
viewRefreshModeset toonRegionenable dynamic loading of data when a Region becomes active. -
Creating Super-Overlays involves subdividing large images into tiles, organizing them hierarchically, and defining Regions and NetworkLinks for each tile.
Regions are a powerful KML feature that allows you to add very large datasets to Google Earth without sacrificing performance. Data is loaded and drawn only when it falls within the user's view and occupies a certain portion of the screen. Using Regions, you can supply separate levels of detail for the data, so that fine details are loaded only when the data fills a portion of the screen that is large enough for the details to be visible.
Key Concepts
Any Feature can contain a Region. A Region affects visibility of a Placemark's geometry or an Overlay's image. Regions define both culling and level-of-detail behavior of the affected geometry or overlay. Regions are inherited through the KML hierarchy and affect the visibility of Features that are defined lower in the hierarchy.
This section describes the following key concepts that are necessary to understanding Regions:
- Inheritance
- Bounding Box
- Level of Detail (LOD)
- Altitude
- Fade Extent
- Nesting Regions
- Region-based NetworkLinks
Inheritance
In KML, some classes are derived from a "base" class. The derived classes inherit all of the elements of their base class and add some specific elements of their own. (This is a common technique of object-oriented systems.) For convenience, this section refers to the base class instead of listing all of the derived classes. For example:
- The term Feature refers to any KML element that is derived from Feature: Document, Folder, GroundOverlay, NetworkLink, PhotoOverlay, Placemark, and ScreenOverlay.
- Geometry refers to any geometric element in KML: Point, Polygon, LinearRing, LineString, Model, MultiGeometry.
- Overlay refers to the elements derived from Overlay: GroundOverlay, PhotoOverlay, and Screen Overlay.
See the KML Reference for a diagram showing inheritance within KML elements.
Bounding Box
A Region has a <LatLonAltBox> that defines a bounding box for your data. A bounding box is a volume that encloses a set of objects or data points. Similar to the <LatLonBox> in a GroundOverlay, the <LatLonAltBox> in a Region has North, South, East, and West boundaries. If the data contained by the Region is 3D, or is 2D at altitude, then the Region's <LatLonAltBox> also needs to include a minimum altitude, <minAltitude>, and a maximum altitude, <maxAltitude>.
Objects associated with this bounding box are drawn when (1) the Region comes within view and (2) the projected onscreen size of the <LatLonAltBox> falls within the specified pixel range for that Region, as described in Level of Detail (LOD) . When both of these conditions are met, the Region is said to be "active."
Level of Detail (LOD)
The second important concept related to Regions is that of Level of Detail, or LOD for short. Since a computer screen has a limited amount of space, it's most efficient to set things up so that large amounts of data are loaded only when there are enough pixels to display the data adequately. When the Region is taking up a relatively small portion of the screen (perhaps because the user is viewing it from a great distance, or it is a flat area being viewed obliquely), the LOD mechanism allows you (the KML author) to specify a dataset with lower resolution to be substituted for the full-resolution data. This lower-resolution dataset loads faster, and since it occupies a small portion of the screen anyway, the user cannot possibly discern the difference.
In a Region, the <minLodPixels> and <maxLodPixels> elements allow you to specify an area of the screen (in square pixels). When your data is projected onto the screen, it must occupy an area of the screen that is greater than <minLodPixels> and less than <maxLodPixels> in order to be visible. Once the projected size of the Region goes outside of these limits, it is no longer visible, and the Region becomes inactive.
In the special case where you want the data to be active to infinite size, specify −1 (the default) for <maxLodPixels>.
Example 1: Region for a Ground Overlay
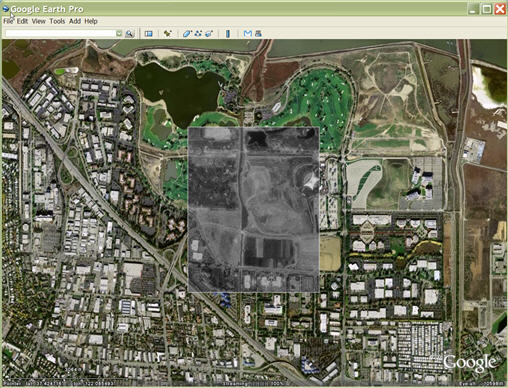
First, let's look at a simple example that constructs a Region for a 2D overlay at ground level. This example uses a ground overlay containing historic data showing a portion of Mountain View, California, in 1991. As the user zooms in on the area, the overlay becomes visible. Here is what the overlay looks like when it is first visible (the example file also includes a white LineString to make the overlay stand out better):
In this example, <minLodPixels> is 128, which means that the GroundOverlay comes into view when it occupies 128 square pixels on the screen. (The example uses the default value of -1 for <maxLodPixels>, which means that it will remain visible as the user zooms in at this angle.) The image used for this overlay is 256 square pixels square.
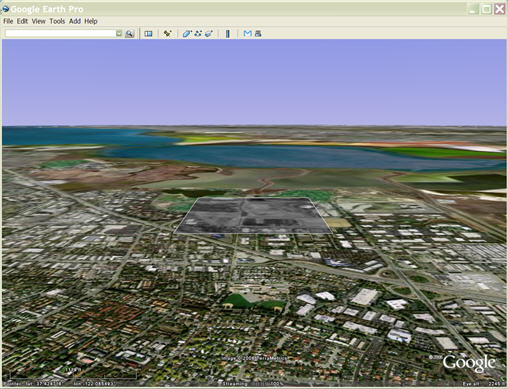
Here is what the image looks like as the user zooms in on it:
And here is what the tilted image looks like just before it becomes invisible because it consumes less screen space than the <minLodPixels> value:
The <LatLonAltBox> for this data does not need to include the <minAltitude> and <maxAltitude> elements because the data is flat and is at ground level. The bounding box for the data in the Region's <LatLonAltBox> is identical to the boundaries of the ground overlay's <LatLonBox>, as shown in the KML file below:
<?xml version="1.0" encoding="UTF-8"?>
<kml xmlns="http://www.opengis.net/kml/2.2">
  <Document>
    <name>Flat Region</name>
    <Region>
      <LatLonAltBox>
        <north>37.430419921875</north>
        <south>37.41943359375</south>
        <east>-122.080078125</east>
        <west>-122.091064453125</west>
      </LatLonAltBox>
      <Lod>
        <minLodPixels>128</minLodPixels>
      </Lod>
    </Region>
    <GroundOverlay>
      <name>Mountain View DOQQ</name>
      <Icon>
        <href>files/image.JPEG</href>
      </Icon>
      <LatLonBox>
        <north>37.430419921875</north>
        <south>37.41943359375</south>
        <east>-122.080078125</east>
        <west>-122.091064453125</west>
      </LatLonBox>
    </GroundOverlay>
  </Document>
</kml>
Also, within the KML file, notice that the Region is a sibling of the image (or geometry) whose visibility it affects.
Now that you've had time to examine the KML file, click the following link to load the overlay into Google Earth. Then experiment with different viewpoints and watch when the Region comes into view and out of view, depending on how much of the screen area it requires. Note that if you tilt the view far enough or if you zoom out quite a bit, the overlay disappears because it takes up too little screen space to meet the <minLodPixels> requirement.
View example in Google Earth (historicOverlay.kmz)
Altitude
Example 2: Region for a 3D Model
The following example shows how to construct a Region that contains 3D objects at ground level. The <LatLonAltBox> for this Region contains a <maxAltitude> of 300 meters since that is the height of the building. You'll probably recognize these buildings as the United Nations complex in New York City.
It's important to notice that the boundaries of the Region's <LatLonAltBox> do not necessarily match up exactly with the longitude and latitude boundaries of the Model. The coordinates for the Model are relative to its own local origin, which may be offset from the actual position of the Model on the Earth.
<?xml version='1.0' encoding='UTF-8'?>
<kml xmlns="http://www.opengis.net/kml/2.2">
  <Document>
    <name>3D Region on ground</name>
    <Placemark>
      <name>United Nations Headquarters</name>
      <visibility>0</visibility>
      <Region>
        <Lod>
          <minLodPixels>128</minLodPixels>
        </Lod>
        <LatLonAltBox>
          <north>40.750683130314</north>
          <south>40.748162385230</south>
          <east>-73.966608428427</east>
          <west>-73.969476624071</west>
          <minAltitude>0</minAltitude>
          <maxAltitude>300</maxAltitude>
          <altitudeMode>absolute</altitudeMode>
        </LatLonAltBox>
      </Region>
      <Model>
        <altitudeMode>absolute</altitudeMode>
        <Location>
          <longitude>-73.967763927199</longitude>
          <latitude>40.749458312255</latitude>
          <altitude>0.406173708576</altitude>
        </Location>
        <Link>
          <href>models/un.dae</href>
        </Link>
      </Model>
    </Placemark>
  </Document>
</kml>
Click the following link to load the file into Google Earth. Again, experiment with different viewpoints to see when the buildings become visible and when they are removed from the view.
View example in Google Earth (unitedNations.kmz)
Example 3: Region for a 2D Overlay at Altitude
This example shows how you would add a 2D overlay to display above the Earth's surface at a specified altitude. This technique is useful for data showing weather fronts and air traffic patterns. Here, the example shows a small cloud cover at an altitude of 100,000 meters above sea level.
The Region's <LatLonAltBox> specifies a value of 100,000 meters for both the <minAltitude> and <maxAltitude> elements. (The value is the same for both elements, since the Overlay is 2D and has no thickness.) The <altitudeMode> is absolute, which means that this value is relative to sea level.
Notice that the <altitude> value of the GroundOverlay is also 100,000 (that is, it matches the altitude value of the Region's bounding box), and the <altitudeMode> of the GroundOverlay matches the value specified for the Region's <altitudeMode>.
<?xml version="1.0" encoding="UTF-8"?>
<kml xmlns="http://www.opengis.net/kml/2.2">
  <Document>
    <name>Flat Region at altitude</name>
    <GroundOverlay>
      <name>Cloud overlay</name>
      <Region>
        <LatLonAltBox>
          <north>33.75</north>
          <south>22.5</south>
          <east>-45</east>
          <west>-56.25</west>
          <minAltitude>100000</minAltitude>
          <maxAltitude>100000</maxAltitude>
          <altitudeMode>absolute</altitudeMode>
        </LatLonAltBox>
        <Lod>
          <minLodPixels>128</minLodPixels>
        </Lod>
      </Region>
      <Icon>
        <href>files/image.PNG</href>
      </Icon>
      <altitude>100000</altitude>
      <altitudeMode>absolute</altitudeMode>
      <LatLonBox>
        <north>33.75</north>
        <south>22.5</south>
        <east>-45</east>
        <west>-56.25</west>
      </LatLonBox>
    </GroundOverlay>
  </Document>
</kml>
View example in Google Earth (cloudRegion.kmz)
Fade Extent
You can also specify a fade extent for a Region, which allows an object to transition gracefully from transparent to opaque, and back again. Google Earth uses the maxFadeExtent to determine the ramp from fully transparent to fully opaque when the Region is at its maximum visible size, and it uses minFadeExtent to determine the fade ramp when the Region is at its minimum visible size. Fade ranges are optional, but they prevent the "pop" effect between LineStrings or Polygons of different resolutions. Fading is very expensive in terms of performance and should not be used with imagery.
Note: The fade range applies to all objects except for placemark icons. These icons are drawn when the fade range is greater than 0.5.
The following example illustrates how the fade extent affects a LineString.
<?xml version="1.0" encoding="UTF-8"?>
<kml xmlns="http://www.opengis.net/kml/2.2">
<Document>
  <name>Region in Placemark LineString</name>
  <description>
    The LineString corners mark the extent
    of the Region LatLonAltBox.
    The LineString minFadeExtent (at greatest range)
    is 1/4 of the maxFadeExtent (at closest range)..
  </description>
  <Placemark>
    <name>Region LineString</name>
    <LineString>
      <coordinates>
        22,50,0
        28,50,0
        28,45,0
        22,45,0
        22,50,0
      </coordinates>
    </LineString>
    <Region>
      <LatLonAltBox>
        <north>50</north>
        <south>45</south>
        <east>28</east>
        <west>22</west>
      </LatLonAltBox>
      <Lod>
        <minLodPixels>128</minLodPixels>
        <maxLodPixels>1024</maxLodPixels>
        <minFadeExtent>128</minFadeExtent>
        <maxFadeExtent>512</maxFadeExtent>
      </Lod>
    </Region>
  </Placemark>
</Document>
</kml>
View example in Google Earth (fadeLineString.kml)
Nesting Regions
A common use of Regions is to nest them, with the larger Regions associated with coarser resolution, and the smaller, inside Regions associated with increasingly finer levels of detail. In the following figure, each Region has a set of LOD limits that specify the projected screen size of the Region in pixels that is required for the associated Region to be active. As the user's viewpoint moves closer, Regions with finer level of detail (LOD) become active because the Region takes up more screen space. The Regions with finer LOD replace the previously loaded Regions with coarser LODs.
As successive nested Regions become active they can
- Accumulate data associated with each Region (as in the Super-Overlay example described below)
- Replace the data of the previously loaded Region with new data (as illustrated in the previous figure)
A <LatLonAltBox> in a child Region should be wholly contained within the <LatLonAltBox> of its parent Region. Regions are inherited through the Folder and NetworkLink hierarchy. Regions defined locally take precedence over Regions defined higher in the Folder hierarchy. The following example illustrates how the local scope of a Region overrides a Region defined higher in the hierarchy. In this example, the placemark "ukraineRegion" inherits the Region from its parent Document. The Folder "romaniaFolder" specifies its own Region, which is used by the Placemark "romaniaRegion." See the next section on "Smart" Loading of Region-Based Network Links for more examples of how to use Regions within NetworkLinks for maximum efficiency.
<?xml version="1.0" encoding="UTF-8"?>
<kml xmlns="http://www.opengis.net/kml/2.2">
<Document>
  <name>Nested Regions</name>
  <Region>
    <LatLonAltBox>
      <north>56.25</north>
      <south>45</south>
      <east>33.75</east>
      <west>22.5</west>
    </LatLonAltBox>
    <Lod>
      <minLodPixels>128</minLodPixels>
      <maxLodPixels>1024</maxLodPixels>
    </Lod>
  </Region>
  <Placemark>
    <name>ukraineRegion</name>
    <LineString>
      <tessellate>1</tessellate>
      <coordinates>
        22.5,45,0
        33.75,45,0
        33.75,56.25,0
        22.5,56.25,0
        22.5,45,0
      </coordinates>
    </LineString>
  </Placemark>
  <Folder>
    <name>romaniaFolder</name>
    <Region>
      <LatLonAltBox>
        <north>50.625</north>
        <south>45</south>
        <east>28.125</east>
        <west>22.5</west>
      </LatLonAltBox>
      <Lod>
        <minLodPixels>128</minLodPixels>
        <maxLodPixels>1024</maxLodPixels>
      </Lod>
    </Region>
    <Placemark>
      <name>romaniaRegion</name>
      <LineString>
        <tessellate>1</tessellate>
        <coordinates>
          22.5,45,0
          28.125,45,0
          28.125,50.625,0
          22.5,50.625,0
          22.5,45,0
        </coordinates>
      </LineString>
    </Placemark>
  </Folder>
</Document>
</kml>
"Smart" Loading of Region-Based Network Links
The Region-based NetworkLink shown in the preceding example is the most efficient way to publish a very large dataset in Google Earth. Using Regions in conjunction with NetworkLinks, you can create a hierarchy of pointers, each of which points to a specific sub-Region. The <viewRefreshMode>, as shown in the following KML file, has an onRegion option, which specifies to load the Region data only when the Region is active. If you provide nested Regions with multiple levels of detail, larger amounts of data are loaded only when the user's viewpoint triggers the next load. The following section on Super-Overlays provides a detailed example.
Part 1: Parent file
To run this example, save the first part as usual. Save the second part as romaniaRegion.kml so that the NetworkLink will be able to load the Region when it becomes active.
<?xml version="1.0" encoding="UTF-8"?>
<kml xmlns="http://www.opengis.net/kml/2.2">
<Document>
  <name>Nested Regions</name>
  <Region>
    <LatLonAltBox>
      <north>56.25</north>
      <south>45</south>
      <east>33.75</east>
      <west>22.5</west>
    </LatLonAltBox>
    <Lod>
      <minLodPixels>128</minLodPixels>
      <maxLodPixels>1024</maxLodPixels>
    </Lod>
  </Region>
  <Placemark>
    <name>ukraineRegion</name>
    <LineString>
      <tessellate>1</tessellate>
      <coordinates>
        22.5,45,0
        33.75,45,0
        33.75,56.25,0
        22.5,56.25,0
        22.5,45,0
      </coordinates>
    </LineString>
  </Placemark>
  <NetworkLink>
    <name>romania NetworkLink</name>
    <Region>
      <LatLonAltBox>
        <north>50.625</north>
        <south>45</south>
        <east>28.125</east>
        <west>22.5</west>
      </LatLonAltBox>
      <Lod>
        <minLodPixels>128</minLodPixels>
        <maxLodPixels>1024</maxLodPixels>
      </Lod>
    </Region>
    <Link>
      <href>romaniaRegion.kml</href>
      <viewRefreshMode>onRegion</viewRefreshMode>
    </Link>
  </NetworkLink>
</Document>
</kml>
Part 2: Region-based NetworkLink file
<?xml version="1.0" encoding="UTF-8"?>
<kml xmlns="http://www.opengis.net/kml/2.2">
<Document>
  <name>romania Document</name>
    <Region>
      <LatLonAltBox>
        <north>50.625</north>
        <south>45</south>
        <east>28.125</east>
        <west>22.5</west>
      </LatLonAltBox>
      <Lod>
        <minLodPixels>128</minLodPixels>
        <maxLodPixels>1024</maxLodPixels>
      </Lod>
    </Region>
  <Placemark>
    <name>romaniaRegion</name>
    <LineString>
      <tessellate>1</tessellate>
      <coordinates>
        22.5,45,0
        28.125,45,0
        28.125,50.625,0
        22.5,50.625,0
        22.5,45,0
      </coordinates>
    </LineString>
  </Placemark>
</Document>
</kml>
Super-Overlays
Q: How can I share a 47MB image with the world?
A: One piece at a time.
Q: What happens if everyone tries to do this?
A: If you use Region-based NetworkLinks and supply multiple levels of detail for your imagery as described in this tutorial—no problem!
This section describes how to create a "super-overlay"—a hierarchy of Regions and NetworkLinks that can be used to efficiently serve a large set of imagery. Tiles of appropriate resolution are loaded as portions of the imagery area come into view, with higher resolution tiles loaded as the viewpoint nears. It's a waste of effort to try to display a 7008-by-6720-pixel image on a 1024-by-768 screen. What's more, if the user is miles above the earth's surface, all that data might be crammed into a handful of pixels, and performance is dismal. Super-overlays, such as our sample showing a 1991 DOQQ of Mountain View, California, allow you to take advantage of NetworkLinks and their ability to determine (1) whether a given Region is within view and (2) whether its projected size is appropriate to the current viewpoint. If the Region is "active" (both conditions are met), the NetworkLink loads the data associated with the Region. If the Region is inactive, no data is loaded. If you subdivide the original image into a hierarchy of images with increasing levels of detail, Google Earth can load the imagery that best fits the current view.
To see how this image hierarchy is used, load this sample file into Google Earth and experiment by zooming in and out on the area of interest: Mountain View Historial DOQQ.
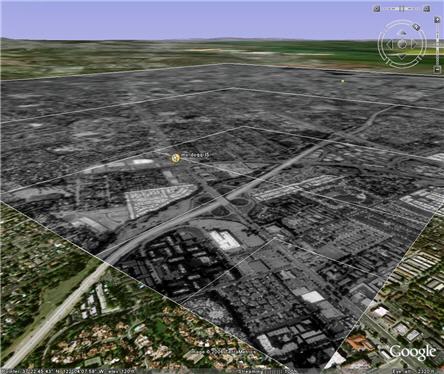 |
Example of using region-based network links to efficiently load a very large dataset. The original image is 7008 by 6720 pixels. The oblique view shown here loads only five small tiles to represent this image. (White linestrings have been added to highlight the tile boundaries.) This application shows presenting historical imagery for the city of Mountain View (a 1991 DOQQ). |
Preparing Your Data for a Super-Overlay
In the sample super-overlay, the original Mountain View image is subdivided into hundreds of small GroundOverlays. These overlays, or tiles, are arranged in a five-level hierarchy. For purposes of example, the discussion here uses a simple three-level hierarchy and a set of 21 overlays, but the principles involved are the same. Note that this is just one approach to creating a hierarchy of region-based network links and that there are other ways to implement this mechanism.
To create a super-overlay, you need to
- Prepare the imagery by subdividing it into manageable chunks (256-by-256 pixels is recommended), and
- Create the KML files that set up the Regions, Links, Network Links, and, in this case, the files containing the GroundOverlays.
Prepare the imagery
Pick a standard size for your tiles, which are the subdivided images (of varying resolutions) that Google Earth will load as their associated Regions become active. For purposes of example, we'll use 256-by-256 pixels for our tiles, which is a small enough size to be manageable.
- Start with the original, full-resolution image. Subdivide it into n tiles, and then subdivide each of those tiles into n tiles.
Continue subdividing until you have tiles of a given size (in our example, 256-by-256 pixels).
Let's assume our original image is 1024-by-1024 pixels.
The following hierarchy would result when we subdivide it. - Resample each tile in the hierarchy to the standard size you've chosen (for example, 256-by-256 pixels).
These resampled tiles will have less detail, but will be associated with Regions that are active at more
distant viewpoints, so the loss in detail will be imperceptible to the user.
The diagram below shows how the viewpoint and the definition of the nested Regions determine which tiles are actually loaded. Three levels of detail are provided for this sample large piece of imagery. When the user looks at the Region from the greatest distance, Google Earth displays the thumbnail view. This view is stretched over its entire LatLonAltBox (but since the projected size is small—256 square pixels—there is no actual loss of visual information). As the user zooms in on the scene, the Region is divided into four Regions. Each of these four "tiles" has the same size as the thumbnail image but provides more detailed imagery.
If the user continues to zoom in on the area, portions of the full resolution imagery come into view, depending on how close the user travels to them. Areas in the distance retain the less detailed imagery that was loaded first. In the Mountain View DOQQ example, enable "Boxes" and check out Placemarks A and B, which use LineStrings around the Regions and show multiple levels of the hierarchy at one time.
Notice that the sample uses the same values for minLodPixels and maxLodPixels for all Regions (at all levels of the hierarchy). It's the LatLonAltBox that determines which level of the hierarchy should be loaded, and which tile(s) within the Region.
Prepare the KML files
For each image, prepare a KML file that associates the ground overlay with a Region and a NetworkLink. Each KML file in this set has the following elements:
- a Region (with LatLonAltBox, minLodPixels, and maxLodPixels so that Google Earth can determine whether the Region is active at any given time)
- a set of NetworkLinks to the child files (the tiles in the next level of the hierarchy)
- the ground overlay for this Region
This sample shows the top-level KML file for the Mountain View DOQQ example. For maxLodPixels, it specifies -1, which has the special meaning "active to infinite size." Without this specification, the entire hierarchy might never be triggered.
<?xml version="1.0" encoding="UTF-8"?>
<kml xmlns="http://www.opengis.net/kml/2.2">
  <NetworkLink>
    <name>SuperOverlay: MV DOQQ</name>
    <Region>
      <LatLonAltBox>
        <north>37.44140625</north>
        <south>37.265625</south>
        <east>-121.9921875</east>
        <west>-122.16796875</west>
      </LatLonAltBox>
      <Lod>
        <minLodPixels>128</minLodPixels>
        <maxLodPixels>-1</maxLodPixels>
      </Lod>
    </Region>
    <Link>
      <href>http://mw1.google.com/mw-earth-vectordb/kml-samples/mv-070501/1.kml</href>
      <viewRefreshMode>onRegion</viewRefreshMode>
    </Link>
  </NetworkLink>
</kml>
The following file shows a Region in the Mountain View DOQQ example (179.kml). This file contains five href tags: four refer to the four KML files in the next level of the image hierarchy, and one refers to the image file used for the GroundOverlay for this tile.
<?xml version="1.0" encoding="UTF-8"?>
<kml xmlns="http://www.opengis.net/kml/2.2">
  <Document>
    <Region>
      <Lod>
        <minLodPixels>128</minLodPixels><maxLodPixels>-1</maxLodPixels>
      </Lod>
      <LatLonAltBox>
        <north>37.430419921875</north><south>37.41943359375</south>
        <east>-122.091064453125</east><west>-122.10205078125</west>
      </LatLonAltBox>
    </Region>
    <NetworkLink>
      <name>001120</name>
      <Region>
        <Lod>
          <minLodPixels>128</minLodPixels><maxLodPixels>-1</maxLodPixels>
        </Lod>
        <LatLonAltBox>
          <north>37.430419921875</north><south>37.4249267578125</south>
          <east>-122.0965576171875</east><west>-122.10205078125</west>
        </LatLonAltBox>
      </Region>
      <Link>
        <href>180.kml</href>
        <viewRefreshMode>onRegion</viewRefreshMode>
      </Link>
    </NetworkLink>
    <NetworkLink>
      <name>001121</name>
      <Region>
        <Lod>
          <minLodPixels>128</minLodPixels><maxLodPixels>-1</maxLodPixels>
        </Lod>
        <LatLonAltBox>
          <north>37.430419921875</north><south>37.4249267578125</south>
          <east>-122.091064453125</east><west>-122.0965576171875</west>
        </LatLonAltBox>
      </Region>
      <Link>
        <href>185.kml</href>
        <viewRefreshMode>onRegion</viewRefreshMode>
      </Link>
    </NetworkLink>
    <NetworkLink>
      <name>001122</name>
      <Region>
        <Lod>
          <minLodPixels>128</minLodPixels><maxLodPixels>-1</maxLodPixels>
        </Lod>
        <LatLonAltBox>
          <north>37.4249267578125</north><south>37.41943359375</south>
          <east>-122.0965576171875</east><west>-122.10205078125</west>
        </LatLonAltBox>
      </Region>
      <Link>
        <href>190.kml</href>
        <viewRefreshMode>onRegion</viewRefreshMode>
      </Link>
    </NetworkLink>
    <NetworkLink>
      <name>001123</name>
      <Region>
        <Lod>
          <minLodPixels>128</minLodPixels><maxLodPixels>-1</maxLodPixels>
        </Lod>
        <LatLonAltBox>
          <north>37.4249267578125</north><south>37.41943359375</south>
          <east>-122.091064453125</east><west>-122.0965576171875</west>
        </LatLonAltBox>
      </Region>
      <Link>
        <href>195.kml</href>
        <viewRefreshMode>onRegion</viewRefreshMode>
      </Link>
    </NetworkLink>
    <GroundOverlay>
      <drawOrder>5</drawOrder>
      <Icon>
        <href>179.JPEG</href>
      </Icon>
      <LatLonBox>
        <north>37.430419921875</north><south>37.41943359375</south>
        <east>-122.091064453125</east><west>-122.10205078125</west>
      </LatLonBox>
    </GroundOverlay>
  </Document>
</kml>