- Dataset Availability
- 2012-01-19T00:00:00Z–2025-02-19T00:00:00Z
- Dataset Provider
- NASA Land SIPS
- Earth Engine Snippet
-
ee.ImageCollection("NASA/VIIRS/002/VNP09GA")
- Cadence
- 1 Day
- Tags
Description
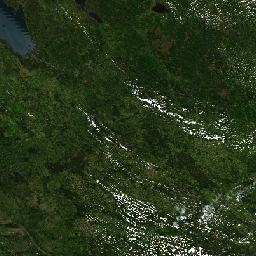
The Visible Infrared Imaging Radiometer Suite (VIIRS) daily surface reflectance (VNP09GA) product provides an estimate of land surface reflectance from the Suomi National Polar-Orbiting Partnership (S-NPP) VIIRS sensor. Data are provided for three imagery bands (I1, I2, I3) at nominal 500 meter resolution (~463 meter) and nine moderate-resolution bands (M1, M2, M3, M4, M5, M7, M8, M10, M11) at nominal 1 kilometer (~926 meter) resolution. The 500 meter and 1 kilometer datasets are derived through resampling the native 375 meter and 750 meter VIIRS resolutions, respectively, in the L2 input product. These bands are corrected for atmospheric conditions to provide an estimate of the surface spectral reflectance as it would be measured at ground level.
The data is temporally aggregated over each of the 16 possible passes per day. When multiple observations are present for each day, only the first of the highest-quality observations is included.
The band scale factors are already applied.
For additional information, visit the VIIRS Land Product Quality Assessment website
Documentation:
Bands
Bands
| Name | Units | Min | Max | Pixel Size | Wavelength | Description | |||||||||||||||||||||||||||||||||||||||||||||||||||||||||||||||||||||||||||||||||||||||||||||
|---|---|---|---|---|---|---|---|---|---|---|---|---|---|---|---|---|---|---|---|---|---|---|---|---|---|---|---|---|---|---|---|---|---|---|---|---|---|---|---|---|---|---|---|---|---|---|---|---|---|---|---|---|---|---|---|---|---|---|---|---|---|---|---|---|---|---|---|---|---|---|---|---|---|---|---|---|---|---|---|---|---|---|---|---|---|---|---|---|---|---|---|---|---|---|---|---|---|---|---|
M1 |
-0.01 | 1.6 | 1000 meters | 0.402 - 0.422µm | 1km surface reflectance band M1 |
||||||||||||||||||||||||||||||||||||||||||||||||||||||||||||||||||||||||||||||||||||||||||||||
M2 |
-0.01 | 1.6 | 1000 meters | 0.436 - 0.454µm | 1km surface reflectance Band M2 |
||||||||||||||||||||||||||||||||||||||||||||||||||||||||||||||||||||||||||||||||||||||||||||||
M3 |
-0.01 | 1.6 | 1000 meters | 0.478 - 0.488µm | 1km surface reflectance band M3 |
||||||||||||||||||||||||||||||||||||||||||||||||||||||||||||||||||||||||||||||||||||||||||||||
M4 |
-0.01 | 1.6 | 1000 meters | 0.545 - 0.565µm | 1km surface reflectance band M4 |
||||||||||||||||||||||||||||||||||||||||||||||||||||||||||||||||||||||||||||||||||||||||||||||
M5 |
-0.01 | 1.6 | 1000 meters | 0.662 - 0.682µm | 1km surface reflectance band M5 |
||||||||||||||||||||||||||||||||||||||||||||||||||||||||||||||||||||||||||||||||||||||||||||||
M7 |
-0.01 | 1.6 | 1000 meters | 0.846 - 0.885µm | 1km surface reflectance band M7 |
||||||||||||||||||||||||||||||||||||||||||||||||||||||||||||||||||||||||||||||||||||||||||||||
M8 |
-0.01 | 1.6 | 1000 meters | 1.230 - 1.250µm | 1km surface reflectance band M8 |
||||||||||||||||||||||||||||||||||||||||||||||||||||||||||||||||||||||||||||||||||||||||||||||
M10 |
-0.01 | 1.6 | 1000 meters | 1.580 - 1.640µm | 1km surface reflectance band M10 |
||||||||||||||||||||||||||||||||||||||||||||||||||||||||||||||||||||||||||||||||||||||||||||||
M11 |
-0.01 | 1.6 | 1000 meters | 2.230 - 2.280µm | 1km surface reflectance band M11 |
||||||||||||||||||||||||||||||||||||||||||||||||||||||||||||||||||||||||||||||||||||||||||||||
I1 |
-0.01 | 1.6 | 500 meters | 0.600 - 0.680µm | 500m surface reflectance band I1 |
||||||||||||||||||||||||||||||||||||||||||||||||||||||||||||||||||||||||||||||||||||||||||||||
I2 |
-0.01 | 1.6 | 500 meters | 0.850 - 0.880µm | 500m surface reflectance band I2 |
||||||||||||||||||||||||||||||||||||||||||||||||||||||||||||||||||||||||||||||||||||||||||||||
I3 |
-0.01 | 1.6 | 500 meters | 1.580 - 1.640µm | 500m surface reflectance band I3 |
||||||||||||||||||||||||||||||||||||||||||||||||||||||||||||||||||||||||||||||||||||||||||||||
SensorAzimuth |
deg | -180 | 180 | 1000 meters | Sensor azimuth angle |
||||||||||||||||||||||||||||||||||||||||||||||||||||||||||||||||||||||||||||||||||||||||||||||
SensorZenith |
deg | 0 | 180 | 1000 meters | Sensor zenith angle |
||||||||||||||||||||||||||||||||||||||||||||||||||||||||||||||||||||||||||||||||||||||||||||||
SolarAzimuth |
deg | -180 | 180 | 1000 meters | Solar azimuth angle |
||||||||||||||||||||||||||||||||||||||||||||||||||||||||||||||||||||||||||||||||||||||||||||||
SolarZenith |
deg | 0 | 180 | 1000 meters | Solar zenith angle |
||||||||||||||||||||||||||||||||||||||||||||||||||||||||||||||||||||||||||||||||||||||||||||||
iobs_res |
0 | 254 | 500 meters | Observation number |
|||||||||||||||||||||||||||||||||||||||||||||||||||||||||||||||||||||||||||||||||||||||||||||||
num_observations_1km |
0 | 127 | 1000 meters | Number of observations 1km |
|||||||||||||||||||||||||||||||||||||||||||||||||||||||||||||||||||||||||||||||||||||||||||||||
num_observations_500m |
0 | 127 | 500 meters | Number of observations 500m |
|||||||||||||||||||||||||||||||||||||||||||||||||||||||||||||||||||||||||||||||||||||||||||||||
obscov_1km |
% | 0 | 100 | 1000 meters | Observations coverage 1km |
||||||||||||||||||||||||||||||||||||||||||||||||||||||||||||||||||||||||||||||||||||||||||||||
obscov_500m |
% | 0 | 100 | 500 meters | Observations coverage 500km |
||||||||||||||||||||||||||||||||||||||||||||||||||||||||||||||||||||||||||||||||||||||||||||||
orbit_pnt |
0 | 15 | 1000 meters | Orbit pointer |
|||||||||||||||||||||||||||||||||||||||||||||||||||||||||||||||||||||||||||||||||||||||||||||||
QF1 |
1000 meters | Quality flags 1 |
|||||||||||||||||||||||||||||||||||||||||||||||||||||||||||||||||||||||||||||||||||||||||||||||||
QF2 |
1000 meters | Quality flags 2 |
|||||||||||||||||||||||||||||||||||||||||||||||||||||||||||||||||||||||||||||||||||||||||||||||||
QF3 |
1000 meters | Quality flags 3 |
|||||||||||||||||||||||||||||||||||||||||||||||||||||||||||||||||||||||||||||||||||||||||||||||||
QF4 |
1000 meters | Quality flags 4 |
|||||||||||||||||||||||||||||||||||||||||||||||||||||||||||||||||||||||||||||||||||||||||||||||||
QF5 |
1000 meters | Quality flags 5 |
|||||||||||||||||||||||||||||||||||||||||||||||||||||||||||||||||||||||||||||||||||||||||||||||||
QF6 |
1000 meters | Quality flags 6 |
|||||||||||||||||||||||||||||||||||||||||||||||||||||||||||||||||||||||||||||||||||||||||||||||||
QF7 |
1000 meters | Quality flags 7 |
|||||||||||||||||||||||||||||||||||||||||||||||||||||||||||||||||||||||||||||||||||||||||||||||||
land_water_mask |
0 | 7 | 1000 meters | Land/water mask. |
|||||||||||||||||||||||||||||||||||||||||||||||||||||||||||||||||||||||||||||||||||||||||||||||
land_water_mask Class Table
| Value | Color | Description |
|---|---|---|
| 0 | #0000ff | Shallow_Ocean |
| 1 | #008000 | Land |
| 2 | #ffff00 | Coastline |
| 3 | #808000 | Shallow_Inland |
| 4 | #00ffff | Ephemeral |
| 5 | #800000 | Deep_Inland |
| 6 | #ff0000 | Continental |
| 7 | #000080 | Deep_Ocean |
Terms of Use
Terms of Use
LP DAAC NASA data are freely accessible; however, when an author publishes these data or works based on the data, it is requested that the author cite the datasets within the text of the publication and include a reference to them in the reference list.
Citations
Vermote, E., Franch, B., Claverie, M. (2023). VIIRS/NPP Surface Reflectance Daily L2G Global 1km and 500m SIN Grid V002 [Data set]. NASA EOSDIS Land Processes Distributed Active Archive Center.
DOIs
Explore with Earth Engine
Code Editor (JavaScript)
var dataset = ee.ImageCollection('NASA/VIIRS/002/VNP09GA')
                  .filter(ee.Filter.date('2014-05-01', '2014-05-31'));

var rgb = dataset.select(['M5', 'M4', 'M3']);
var rgbVis = {
  min: 0.0,
  max: 0.3
};
Map.setCenter(17.93, 7.71, 2);
Map.addLayer(rgb, rgbVis, 'RGB');