-
2000 年グリーンランド モザイク - グリーンランド氷床マッピング プロジェクト(GIMP)
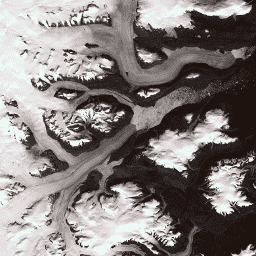
このデータセットは、1999 年から 2002 年の Landsat 7 ETM+ と RADARSAT-1 SAR 画像から導出された、グリーンランド氷床の完全な 15 m 解像度の画像モザイクを提供します。この方法には、画像雲マスキング、パンシャープニング、画像サンプリングとサイズ変更などを組み合わせたものが含まれます。 arctic gimp greenland imagery nasa polar -
CryoSat-2 南極 1 km DEM

このデータセットは、2010 年 7 月から 2016 年 7 月の間に CryoSat-2 衛星レーダー高度計で記録された観測データに基づく、南極氷床と棚氷の数値標高モデル(DEM)です。DEM は、1, … antarctica dem elevation elevation-topography polar -
グリーンランド DEM - グリーンランド マッピング プロジェクト(GIMP)
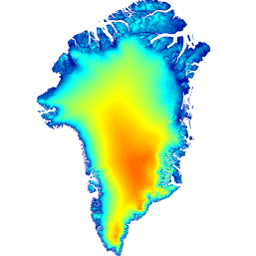
この数値標高モデル(DEM)は、約 82.5°N より南の氷床周辺部と縁辺部(平衡線標高より下)の ASTER と SPOT-5 の DEM と、氷床内部と最北部の AVHRR フォトクリノメトリーを組み合わせて構築されています(Scambos と … arctic elevation-topography gimp greenland nasa polar -
Greenland Ice & Ocean Mask - Greenland Mapping Project(GIMP)

このデータセットは、グリーンランド氷床の 15 m の完全な陸氷と海洋の分類マスクを提供します。氷床は、USGS が配布する Landsat 7 Enhanced Thematic Mapper Plus(ETM+)のオルソ補正されたパンクロマチック(バンド 8)画像と、… arctic cryosphere gimp greenland ice nasa -
MEaSUREs Greenland Ice Velocity: Selected Glacier Site Velocity Maps from Optical Images Version 2

このデータセットは、NASA の Making Earth System Data Records for Use in Research Environments(MEaSUREs)プログラムの一部で、選択した氷河出口領域の月平均速度マップで構成されています。この地図は、Landsat が取得した光学画像ペア間の可視特徴を追跡することで生成されます。 arctic cryosphere gimp greenland ice nasa