- カタログ オーナー
- Awesome GEE Community Catalog
- データセットの利用可能な期間
- 2000-01-04T00:00:00Z–2026-02-10T00:00:00Z
- データセット プロデューサー
- National Drought Mitigation Center
- タグ
説明
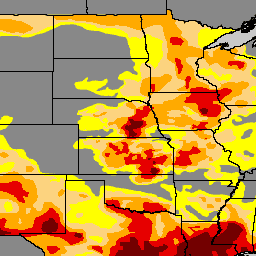
米国干ばつモニターは、毎週木曜日に公開される地図で、米国で干ばつが発生している地域を示しています。この地図では、異常に乾燥(D0)の 5 つの分類が使用されています。異常に乾燥は、干ばつに移行する可能性のある地域や干ばつから脱却する可能性のある地域を示します。また、干ばつには中程度(D1)、深刻(D2)、極端(D3)、異常(D4)の 4 つのレベルがあります。Drought Monitor は、1999 年の開始以来、ネブラスカ大学リンカーン校の国立干ばつ緩和センター(NDMC)、米国海洋大気庁(NOAA)、米国農務省(USDA)が共同で作成しているチームの取り組みです。NDMC は、干ばつモニターのウェブサイトと関連データをホストし、地図とデータを NOAA、USDA、その他の機関に提供しています。droughtmonitor.unl.edu で無料で利用できます。
バンド
ピクセルサイズ
250 メートル
バンド
| 名前 | 最小 | 最大 | ピクセルサイズ | 説明 |
|---|---|---|---|---|
DM |
0 | 4 | メートル | 干ばつクラス |
利用規約
利用規約
この作品は、オープンデータ ライセンスに基づいて使用許諾されています。米国干ばつモニターは、ネブラスカ大学リンカーン校の国立干ばつ緩和センター、米国農務省、米国海洋大気庁が共同で作成しています。地図提供: NDMC。
引用
引用:
National Drought Mitigation Center、米国農務省、米国海洋大気庁(2023 年)。米国干ばつモニター。ネブラスカ大学リンカーン校。https://droughtmonitor.unl.edu/。2023 年 9 月 17 日にアクセス
Earth Engine で探索する
コードエディタ(JavaScript)
var usdm = ee.ImageCollection(
  "projects/sat-io/open-datasets/us-drought-monitor"
);
/*
Category	Description
DO	Abnormally Dry
D1	Moderate Drought
D2	Severe Drought
D3	Extreme Drought
D4	Exceptional Drought
*/

var usdm = ee.Image(usdm.toList(usdm.size()).get(-1));

// Define a dictionary which will be used to make legend and visualize image on map
var dict = {
  names: [
    "DO	Abnormally Dry", //1
    "D1 Moderate Drought", //2
    "D2 Severe Drought", //3
    "D3 Extreme Drought", //4
    "D4 Exceptional Drought", //5
  ],
  colors: ["FFFF00", "FCD37F", "FFAA00", "E60000", "730000"],
};

// Create a panel to hold the legend widget
var legend = ui.Panel({
  style: {
    position: "bottom-left",
    padding: "8px 15px",
  },
});

// Function to generate the legend
function addCategoricalLegend(panel, dict, title) {
  // Create and add the legend title.
  var legendTitle = ui.Label({
    value: title,
    style: {
      fontWeight: "bold",
      fontSize: "18px",
      margin: "0 0 4px 0",
      padding: "0",
    },
  });
  panel.add(legendTitle);

  var loading = ui.Label("Loading legend...", { margin: "2px 0 4px 0" });
  panel.add(loading);

  // Creates and styles 1 row of the legend.
  var makeRow = function (color, name) {
    // Create the label that is actually the colored box.
    var colorBox = ui.Label({
      style: {
        backgroundColor: color,
        // Use padding to give the box height and width.
        padding: "8px",
        margin: "0 0 4px 0",
      },
    });

    // Create the label filled with the description text.
    var description = ui.Label({
      value: name,
      style: { margin: "0 0 4px 6px" },
    });

    return ui.Panel({
      widgets: [colorBox, description],
      layout: ui.Panel.Layout.Flow("horizontal"),
    });
  };

  // Get the list of palette colors and class names from the image.
  var palette = dict["colors"];
  var names = dict["names"];
  loading.style().set("shown", false);

  for (var i = 0; i < names.length; i++) {
    panel.add(makeRow(palette[i], names[i]));
  }

  Map.add(panel);
}

/*
  // Display map and legend ///////////////////////////////////////////////////////////////////////////////
*/

// Add the legend to the map
addCategoricalLegend(legend, dict, "US Drought Monitor");

// Add USDM Image image to the map
Map.addLayer(
  usdm,
  { min: 0, max: 4, palette: dict["colors"] },
  usdm.get("system:index").getInfo()
);