- カタログ オーナー
- Awesome GEE Community Catalog
- データセットの利用可能な期間
- 2000-01-01T00:00:00Z–2023-12-31T00:00:00Z
- データセット プロデューサー
- オークリッジ国立研究所
- タグ
説明
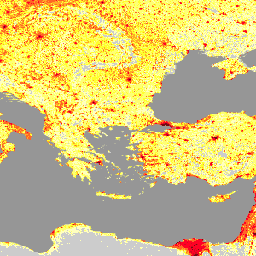
オークリッジ国立研究所(ORNL)が提供する LandScan データセットは、包括的で高解像度の世界人口分布データセットであり、幅広いアプリケーションにとって貴重なリソースとなります。最先端の空間モデリング手法と高度な地理空間データソースを活用した LandScan は、30 秒角の解像度で人口数と人口密度の詳細な情報を提供し、世界中の人間の居住パターンに関する正確で最新の分析情報を取得できます。LandScan は、その精度と粒度により、都市計画、災害対応、疫学、環境研究など、さまざまな分野をサポートしています。世界規模でさまざまな社会問題や環境問題の理解と解決を目指す意思決定者や研究者にとって、不可欠なツールとなっています。
バンド
ピクセルサイズ
1,000 メートル
バンド
| 名前 | 最小 | 最大 | ピクセルサイズ | 説明 |
|---|---|---|---|---|
b1 |
0* | 21171* | メートル | 推定人口数 |
利用規約
利用規約
Landscan データセットは、クリエイティブ・コモンズ表示 4.0 国際ライセンスに基づいてライセンス供与されています。出典を明記する限り、ユーザーは営利目的と非営利目的の両方で、制限なく自由に作品を使用、複製、配布、送信、改変できます。
引用
引用:
Sims, K.、Reith, A.、Bright, E.、Kaufman, J.、Pyle, J.、Epting, J.、Gonzales, J.、Adams, D.、Powell, E.、Urban, M.、& Rose, A. (2023)。LandScan Global 2022 [データセット]。オークリッジ国立研究所。https://doi.org/10.48690/1529167
DOI
Earth Engine で探索する
コードエディタ(JavaScript)
var landscan_global =
    ee.ImageCollection('projects/sat-io/open-datasets/ORNL/LANDSCAN_GLOBAL');
var popcount_intervals = '<RasterSymbolizer>' +
    ' <ColorMap type="intervals" extended="false" >' +
    '<ColorMapEntry color="#CCCCCC" quantity="0" label="No Data"/>' +
    '<ColorMapEntry color="#FFFFBE" quantity="5" label="Population Count (Estimate)"/>' +
    '<ColorMapEntry color="#FEFF73" quantity="25" label="Population Count (Estimate)"/>' +
    '<ColorMapEntry color="#FEFF2C" quantity="50" label="Population Count (Estimate)"/>' +
    '<ColorMapEntry color="#FFAA27" quantity="100" label="Population Count (Estimate)"/>' +
    '<ColorMapEntry color="#FF6625" quantity="500" label="Population Count (Estimate)"/>' +
    '<ColorMapEntry color="#FF0023" quantity="2500" label="Population Count (Estimate)"/>' +
    '<ColorMapEntry color="#CC001A" quantity="5000" label="Population Count (Estimate)"/>' +
    '<ColorMapEntry color="#730009" quantity="185000" label="Population Count (Estimate)"/>' +
    '</ColorMap>' +
    '</RasterSymbolizer>';

// Define a dictionary which will be used to make legend and visualize image on
// map
var dict = {
  'names': [
    '0', '1-5', '6-25', '26-50', '51-100', '101-500', '501-2500', '2501-5000',
    '5001-185000'
  ],
  'colors': [
    '#CCCCCC', '#FFFFBE', '#FEFF73', '#FEFF2C', '#FFAA27', '#FF6625', '#FF0023',
    '#CC001A', '#730009'
  ]
};

// Create a panel to hold the legend widget
var legend = ui.Panel({style: {position: 'bottom-left', padding: '8px 15px'}});

// Function to generate the legend
function addCategoricalLegend(panel, dict, title) {
  // Create and add the legend title.
  var legendTitle = ui.Label({
    value: title,
    style: {
      fontWeight: 'bold',
      fontSize: '18px',
      margin: '0 0 4px 0',
      padding: '0'
    }
  });
  panel.add(legendTitle);

  var loading = ui.Label('Loading legend...', {margin: '2px 0 4px 0'});
  panel.add(loading);

  // Creates and styles 1 row of the legend.
  var makeRow = function(color, name) {
    // Create the label that is actually the colored box.
    var colorBox = ui.Label({
      style: {
        backgroundColor: color,
        // Use padding to give the box height and width.
        padding: '8px',
        margin: '0 0 4px 0'
      }
    });

    // Create the label filled with the description text.
    var description = ui.Label({value: name, style: {margin: '0 0 4px 6px'}});

    return ui.Panel({
      widgets: [colorBox, description],
      layout: ui.Panel.Layout.Flow('horizontal')
    });
  };

  // Get the list of palette colors and class names from the image.
  var palette = dict['colors'];
  var names = dict['names'];
  loading.style().set('shown', false);

  for (var i = 0; i < names.length; i++) {
    panel.add(makeRow(palette[i], names[i]));
  }

  Map.add(panel);
}

addCategoricalLegend(legend, dict, 'Population Count(estimate)');

Map.addLayer(
    landscan_global.sort('system:time_start')
        .first()
        .sldStyle(popcount_intervals),
    {}, 'Population Count Estimate 2000');
Map.addLayer(
    landscan_global.sort('system:time_start', false)
        .first()
        .sldStyle(popcount_intervals),
    {}, 'Population Count Estimate 2022');