- Dataset Availability
- 2021-07-30T00:00:00Z–2023-10-13T00:00:00Z
- Dataset Provider
- Environmental Defense Fund - MethaneSAT
- Earth Engine Snippet
-
ee.ImageCollection("EDF/MethaneSAT/MethaneAIR/L4area")
- Tags
Description
The area emissions model is still in development and not representative of a final product.
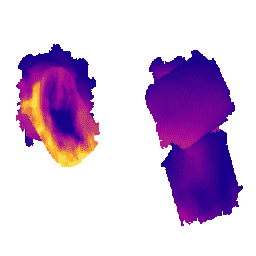
This dataset provides spatially disaggregated methane emission fluxes (kg/hr) using measurements from MethaneAIR flights focused on oil and gas producing regions throughout the United States. Total emissions for the survey area are obtained by summing the pixel values.
Methane is a potent greenhouse gas that has more than 80 times the warming power of carbon dioxide over the first 20 years after it reaches the atmosphere. At least 30% of today's global warming is driven by methane from human actions. Cutting methane emissions associated with human activities - including avoidable emissions from oil and gas operations, agriculture, and waste management - is the single fastest way to slow the rate of global warming.
Area emissions are estimated from observed XCH4 using a geostatistical inverse model framework (see "MethaneAIR L4 Area Sources" dataset). An atmospheric transport model - the Stochastic Time-Inverted Lagrangian Transport model, "STILT"; Lin et al. (2003), Fasoli et al. (2018); driven by meteorological data from the NOAA High-Resolution Rapid Refresh Model "HRRR" - is used to link variations in observed XCH4 to potential upwind sources. A hierarchical approach is used to separate XCH4 variations due to area emissions from those due to point source emissions or inflow across the domain boundary (the "background" concentration). Point source emissions are determined individually (see "MethaneAIR L4 Point Sources" dataset) and pre-subtracted from the observed XCH4. An inverse model is then used to estimate XCH4 inflow across the boundary domain. Finally, area emissions are estimated using a geostatistical inverse model with an enforced non-negative solution. Total emissions are the sum of area and point source emissions.
This dataset was generated using MethaneAIR measurements taken on flights between 30 July 2021 and 13 October 2023. MethaneAIR is an airborne precursor of the MethaneSAT satellite mission, managed by MethaneSAT LLC, a wholly owned subsidiary of Environmental Defense Fund. The methane emission fluxes were produced using a geostatistical inverse modeling framework specialized to exploit the high spatial resolution, wide spatial coverage, and high precision of MethaneAIR data. Not all data products are available for all flights.
For additional information about the MethaneAIR instrument, instrument calibration and emission detections, please refer to recent publications by Loughner et al. (2021), Staebell et al. (2021), Conway et al. (2023), Chulakadabba et al. (2023), Abbadi et al. (2023), Omara et al. (2023), and Miller et al. (2023).
Contact the data provider for more information about the project at this link: https://www.methanesat.org/contact/
Bands
Bands
| Name | Units | Min | Max | Pixel Size | Description |
|---|---|---|---|---|---|
flux |
kg/h/km^2 | 0* | 28.3* | 1000 meters | Methane emissions traceable to a 1km^2 area. |
Image Properties
Image Properties
| Name | Type | Description |
|---|---|---|
| flight_id | STRING | Research flight number. |
| basin | STRING | Oil and Gas basin (e.g. Permian) or area of interest (e.g. New York City). |
| time_coverage_start | STRING | Data collection start time in YYYY-MM-DDThh:mm:ssZ format STRING (ISO 8601). |
| time_coverage_end | STRING | Data collection end time in YYYY-MM-DDThh:mm:ssZ format STRING (ISO 8601). |
| processing_id | STRING | (internal) Processing run identifier that represents the calculations that led to the features. It is not an attribute describing the flight, but the processing pipeline. |
| area_source_total_kg_hr | INT | Total value of area emissions for this flight in kg/hr. Missing values are indicated by -1. |
Terms of Use
Terms of Use
Use of this data is subject to MethaneSAT's Content License Terms of Use.
Citations
Chulakadabba, A., Sargent, M., Lauvaux, T., Benmergui, J. S., Franklin, J. E., Chan Miller, C., Wilzewski, J. S., Roche, S., Conway, E., Souri, A. H., Sun, K., Luo, B., Hawthrone, J., Samra, J., Daube, B. C., Liu, X., Chance, K., Li, Y., Gautam, R., Omara, M., Rutherford, J. S., Sherwin, E. D., Brandt, A., and Wofsy, S. C. 2023. Methane point source quantification using MethaneAIR: a new airborne imaging spectrometer, Atmos. Meas. Tech., 16, 5771-5785. doi:10.5194/amt-16-5771-2023,
Explore with Earth Engine
Code Editor (JavaScript)
var dataset = ee.ImageCollection("EDF/MethaneSAT/MethaneAIR/L4area");

var fluxVisParams = {
  min: 0,
  max: 18,
  palette: ['#070088','#a3069b','#cc4e64','#ffa826','#edfb59'],
};

// Center on one of the available areas of interests.
Map.setCenter(-102.5, 31.85, 8);
Map.addLayer(dataset, fluxVisParams, 'Methane area sources flux');