Slaytlarınıza Grafik Ekleme

Bu sayfada, Google E-Tablolar'daki mevcut grafiklerin nasıl alınacağı ve Google Slaytlar sunularına nasıl ekleneceği açıklanmaktadır.

Sunulara grafik eklemek, daha fazla etki yaratmanıza ve verilerin kitleniz için anlamlı olmasını sağlamanıza yardımcı olabilir. Grafikler bir veri kümesindeki kalıpları veya eğilimleri göstermek için eşsiz güçlü araçlardır ve nicel veriler hakkında net bir şekilde iletişim kurmanıza yardımcı olabilir.

Yukarıdaki videoda e-tablo verilerinden nasıl slayt oluşturulacağı açıklanmaktadır. Slayta grafik ekleyen ve e-tablo hücre verilerini tabloya aktaran eksiksiz bir örnek (Python) içerir.

Grafik ekleme hakkında

Nicel bilgiler sunarken veri grafikleri sununuzu zenginleştirebilir. Slaytlar API'si, Google E-Tablolar'da oluşturabileceğiniz her türlü grafiği (çubuk grafikler, çizgi grafikler, pasta grafikler vb.) dahil etmenize olanak tanır.

Slaytlar API sunusuna Google E-Tablolar grafiği ekleme kavramı

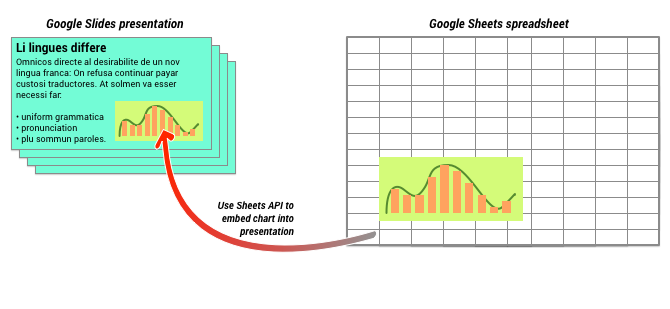
Yukarıdaki şemada gösterildiği gibi, önce Google E-Tablolar'da grafiği oluşturmanız gerekir. Grafik oluşturulduktan sonra bunu sununuza yerleştirebilirsiniz.

Sunumunuzda grafikleri yönetmeye ilişkin genel süreç şu şekildedir:

  1. Google E-Tablolar'da bir grafik oluşturun.
  2. Elde edilen EmbeddedChart'ın grafik kimliğini okumak için Sheets API'yi kullanın.
  3. Metni bir slayta eklemek için bir kez CreateSheetsChartRequest'i kullanın.
  4. Gerekirse kaynak verilerle senkronize etmek için RefreshSheetsChartRequest'i kullanın.

Statik ve bağlı grafikler

Sununuza grafik eklemek için API'yi kullandığınızda, belirttiğiniz parametrelerden biri LinkingMode'dur. Bu, grafiğin statik bir resim olarak mı yoksa daha sonra yenilenebilecek bir nesne olarak mı ekleneceğini belirler.

Aşağıdaki durumlarda LINKED modunu kullanın:

  • Grafiği gelecekte temel verilerdeki değişiklikleri yansıtacak şekilde yenilemek istiyorsunuz.
  • Ortak çalışanların kaynak grafiği içeren e-tablonun bağlantısına sahip olmasını istersiniz.

Aşağıdaki durumlarda NOT_LINKED_IMAGE (statik) modunu kullanın:

  • Grafiğin gelecekte hiçbir zaman değişmemesini istiyorsanız.
  • Ortak çalışanların kaynak e-tablonun bağlantısını görmesini istemiyorsunuz.

Google E-Tablolar'a erişim kapsamları

Slaytınıza bir grafik eklediğinizde Slaytlar API'sinin buna Google E-Tablolar'dan erişmesi gerekir. Bu, isteğinizin aşağıdaki kapsamlardan birini kullanması gerektiği anlamına gelir:

  • https://www.googleapis.com/auth/spreadsheets.readonly (tercih edilen)
  • https://www.googleapis.com/auth/spreadsheets
  • https://www.googleapis.com/auth/drive.readonly
  • https://www.googleapis.com/auth/drive

spreadsheets.readonly kapsamı, en kısıtlayıcı olduğu için genellikle en iyi seçenektir. Ancak uygulamanız yukarıda listelenen diğer kapsamlardan birini zaten kullanıyorsa o kapsamı kullanın.

Grafik ekleme

Grafik eklemek için Google E-Tablolar'daki grafiğin e-tablo kimliğini ve grafik kimliğini bilmeniz gerekir. Ardından, grafiği eklemek için bir kez CreateSheetsChartRequest'i kullanarak batchUpdate yöntemini çağırırsınız.

Aşağıdaki örnekte bir grafik alıp daha sonra yenilenebilmesi için slayta LINKED olarak ekler.

Apps Komut Dosyası

slides/api/Snippets.gs
/**
 * Embed a Sheets chart (indicated by the spreadsheetId and sheetChartId) onto
 *   a page in the presentation. Setting the linking mode as 'LINKED' allows the
 *   chart to be refreshed if the Sheets version is updated.
 * @param {string} presentationId
 * @param {string} pageId
 * @param {string} shapeId
 * @param {string} sheetChartId
 * @returns {*}
 */
function createSheetsChart(presentationId, pageId, shapeId, sheetChartId) {
  const emu4M = {
    magnitude: 4000000,
    unit: 'EMU'
  };
  const presentationChartId = 'MyEmbeddedChart';
  const requests = [{
    createSheetsChart: {
      objectId: presentationChartId,
      spreadsheetId: shapeId,
      chartId: sheetChartId,
      linkingMode: 'LINKED',
      elementProperties: {
        pageObjectId: pageId,
        size: {
          height: emu4M,
          width: emu4M
        },
        transform: {
          scaleX: 1,
          scaleY: 1,
          translateX: 100000,
          translateY: 100000,
          unit: 'EMU'
        }
      }
    }
  }];

  // Execute the request.
  try {
    const batchUpdateResponse = Slides.Presentations.batchUpdate({
      requests: requests
    }, presentationId);
    console.log('Added a linked Sheets chart with ID: %s', presentationChartId);

    return batchUpdateResponse;
  } catch (err) {
    // TODO (Developer) - Handle exception
    console.log('Failed with error: %s', err.error);
  }
};

Go

slaytlar/snippet'ler/sunular.go
// Embed a Sheets chart (indicated by the spreadsheetId and sheetChartId) onto
// a page in the presentation. Setting the linking mode as "LINKED" allows the
// chart to be refreshed if the Sheets version is updated.
emu4M := slides.Dimension{Magnitude: 4000000, Unit: "EMU"}
presentationChartId := "MyEmbeddedChart"
requests := []*slides.Request{{
	CreateSheetsChart: &slides.CreateSheetsChartRequest{
		ObjectId:      presentationChartId,
		SpreadsheetId: spreadsheetId,
		ChartId:       sheetChartId,
		LinkingMode:   "LINKED",
		ElementProperties: &slides.PageElementProperties{
			PageObjectId: pageId,
			Size: &slides.Size{
				Height: &emu4M,
				Width:  &emu4M,
			},
			Transform: &slides.AffineTransform{
				ScaleX:     1.0,
				ScaleY:     1.0,
				TranslateX: 100000.0,
				TranslateY: 100000.0,
				Unit:       "EMU",
			},
		},
	},
}}

// Execute the requests.
body := &slides.BatchUpdatePresentationRequest{Requests: requests}
response, _ := slidesService.Presentations.BatchUpdate(presentationId, body).Do()
fmt.Printf("Added a linked Sheets chart with ID %s", presentationChartId)

Java

slides/snippets/src/main/java/CreateSheetsChart.java
import com.google.api.client.googleapis.json.GoogleJsonError;
import com.google.api.client.googleapis.json.GoogleJsonResponseException;
import com.google.api.client.http.HttpRequestInitializer;
import com.google.api.client.http.javanet.NetHttpTransport;
import com.google.api.client.json.gson.GsonFactory;
import com.google.api.services.slides.v1.Slides;
import com.google.api.services.slides.v1.SlidesScopes;
import com.google.api.services.slides.v1.model.AffineTransform;
import com.google.api.services.slides.v1.model.BatchUpdatePresentationRequest;
import com.google.api.services.slides.v1.model.BatchUpdatePresentationResponse;
import com.google.api.services.slides.v1.model.CreateSheetsChartRequest;
import com.google.api.services.slides.v1.model.Dimension;
import com.google.api.services.slides.v1.model.PageElementProperties;
import com.google.api.services.slides.v1.model.Request;
import com.google.api.services.slides.v1.model.Size;
import com.google.auth.http.HttpCredentialsAdapter;
import com.google.auth.oauth2.GoogleCredentials;

import java.io.IOException;
import java.util.ArrayList;
import java.util.Collections;
import java.util.List;

/* Class to demonstrate the use of Slides Create Chart API */
public class CreateSheetsChart {
  /**
   * Adds chart from spreadsheet to slides as linked.
   *
   * @param presentationId - id of the presentation.
   * @param pageId         - id of the page.
   * @param spreadsheetId  - id of the spreadsheet.
   * @param sheetChartId   - id of the chart in sheets.
   * @return presentation chart id
   * @throws IOException - if credentials file not found.
   */
  public static BatchUpdatePresentationResponse createSheetsChart(
      String presentationId, String pageId, String spreadsheetId, Integer sheetChartId)
      throws IOException {
        /* Load pre-authorized user credentials from the environment.
           TODO(developer) - See https://developers.google.com/identity for
            guides on implementing OAuth2 for your application. */
    GoogleCredentials credentials = GoogleCredentials.getApplicationDefault()
        .createScoped(Collections.singleton(SlidesScopes.PRESENTATIONS));
    HttpRequestInitializer requestInitializer = new HttpCredentialsAdapter(
        credentials);

    // Create the slides API client
    Slides service = new Slides.Builder(new NetHttpTransport(),
        GsonFactory.getDefaultInstance(),
        requestInitializer)
        .setApplicationName("Slides samples")
        .build();

    // Embed a Sheets chart (indicated by the spreadsheetId and sheetChartId) onto
    // a page in the presentation. Setting the linking mode as "LINKED" allows the
    // chart to be refreshed if the Sheets version is updated.
    List<Request> requests = new ArrayList<>();
    Dimension emu4M = new Dimension().setMagnitude(4000000.0).setUnit("EMU");
    String presentationChartId = "MyEmbeddedChart";
    requests.add(new Request()
        .setCreateSheetsChart(new CreateSheetsChartRequest()
            .setObjectId(presentationChartId)
            .setSpreadsheetId(spreadsheetId)
            .setChartId(sheetChartId)
            .setLinkingMode("LINKED")
            .setElementProperties(new PageElementProperties()
                .setPageObjectId(pageId)
                .setSize(new Size()
                    .setHeight(emu4M)
                    .setWidth(emu4M))
                .setTransform(new AffineTransform()
                    .setScaleX(1.0)
                    .setScaleY(1.0)
                    .setTranslateX(100000.0)
                    .setTranslateY(100000.0)
                    .setUnit("EMU")))));

    BatchUpdatePresentationResponse response = null;
    try {
      // Execute the request.
      BatchUpdatePresentationRequest body =
          new BatchUpdatePresentationRequest().setRequests(requests);
      response = service.presentations().batchUpdate(presentationId, body).execute();
      System.out.println("Added a linked Sheets chart with ID " + presentationChartId);
    } catch (GoogleJsonResponseException e) {
      // TODO(developer) - handle error appropriately
      GoogleJsonError error = e.getDetails();
      if (error.getCode() == 404) {
        System.out.printf("Presentation not found with id '%s'.\n", presentationId);
      } else {
        throw e;
      }
    }
    return response;
  }
}

JavaScript

slides/snippets/slides_create_sheets_chart.js
function createSheetsChart(presentationId, pageId, shapeId, sheetChartId, callback) {
  // Embed a Sheets chart (indicated by the spreadsheetId and sheetChartId) onto
  // a page in the presentation. Setting the linking mode as "LINKED" allows the
  // chart to be refreshed if the Sheets version is updated.
  const emu4M = {
    magnitude: 4000000,
    unit: 'EMU',
  };
  const presentationChartId = 'MyEmbeddedChart';
  const requests = [{
    createSheetsChart: {
      objectId: presentationChartId,
      spreadsheetId: shapeId,
      chartId: sheetChartId,
      linkingMode: 'LINKED',
      elementProperties: {
        pageObjectId: pageId,
        size: {
          height: emu4M,
          width: emu4M,
        },
        transform: {
          scaleX: 1,
          scaleY: 1,
          translateX: 100000,
          translateY: 100000,
          unit: 'EMU',
        },
      },
    },
  }];
  // Execute the request.
  try {
    gapi.client.slides.presentations.batchUpdate({
      presentationId: presentationId,
      requests: requests,
    }).then((batchUpdateResponse) => {
      console.log(`Added a linked Sheets chart with ID: ${presentationChartId}`);
      if (callback) callback(batchUpdateResponse.result);
    });
  } catch (err) {
    document.getElementById('content').innerText = err.message;
    return;
  }
}

Node.js

slides/snippets/slides_create_sheets_chart.js
/**
 * Embeds a Sheets chart onto a page in a presentation.
 * @param {string} presentationId The presentation ID.
 * @param {string} pageId The page ID.
 * @param {string} spreadsheetId The spreadsheet ID.
 * @param {string} sheetChartId The sheet's chart ID.
 */
async function createSheetsChart(
    presentationId,
    pageId,
    spreadsheetId,
    sheetChartId,
) {
  const {GoogleAuth} = require('google-auth-library');
  const {google} = require('googleapis');

  const auth = new GoogleAuth({
    scopes: 'https://www.googleapis.com/auth/presentations',
  });

  const service = google.slides({version: 'v1', auth});

  // Embed a Sheets chart (indicated by the spreadsheetId and sheetChartId) onto
  // a page in the presentation. Setting the linking mode as "LINKED" allows the
  // chart to be refreshed if the Sheets version is updated.
  const emu4M = {
    magnitude: 4000000,
    unit: 'EMU',
  };
  const presentationChartId = 'MyEmbeddedChart';
  const requests = [
    {
      createSheetsChart: {
        objectId: presentationChartId,
        spreadsheetId: spreadsheetId,
        chartId: sheetChartId,
        linkingMode: 'LINKED',
        elementProperties: {
          pageObjectId: pageId,
          size: {
            height: emu4M,
            width: emu4M,
          },
          transform: {
            scaleX: 1,
            scaleY: 1,
            translateX: 100000,
            translateY: 100000,
            unit: 'EMU',
          },
        },
      },
    },
  ];

  // Execute the request.
  try {
    const batchUpdateResponse = await service.presentations.batchUpdate({
      presentationId,
      resource: {
        requests,
      },
    });
    console.log(`Added a linked Sheets chart with ID: ${presentationChartId}`);
    return batchUpdateResponse.data;
  } catch (err) {
    // TODO (developer) - Handle exception
    throw err;
  }
}

PHP

slides/snippets/src/SlidesCreateSheetsChart.php
use Google\Client;
use Google\Service\Drive;
use Google\Service\Slides;
use Google\Service\Slides\Request;


function createSheetsChart($presentationId, $pageId, $spreadsheetId, $sheetChartId)
{
    /* Load pre-authorized user credentials from the environment.
       TODO(developer) - See https://developers.google.com/identity for
        guides on implementing OAuth2 for your application. */
    $client = new Google\Client();
    $client->useApplicationDefaultCredentials();
    $client->addScope(Google\Service\Drive::DRIVE);
    $slidesService = new Google_Service_Slides($client);
    // Embed a Sheets chart (indicated by the spreadsheet_id and sheet_chart_id) onto
    // a page in the presentation. Setting the linking mode as "LINKED" allows the
    // chart to be refreshed if the Sheets version is updated.
    try {
        //creating new presentaion chart
        $presentationChartId = 'MyEmbeddedChart';
        $emu4M = array('magnitude' => 4000000, 'unit' => 'EMU');
        $requests = array();
        $requests[] = new Google_Service_Slides_Request(
            array(
                'createSheetsChart' => array(
                    'spreadsheetId' => $spreadsheetId,
                    'chartId' => $sheetChartId,
                    'linkingMode' => 'LINKED',
                    'elementProperties' => array(
                        'pageObjectId' => $pageId,
                        'size' => array(
                            'height' => $emu4M,
                            'width' => $emu4M
                        ),
                        'transform' => array(
                            'scaleX' => 1,
                            'scaleY' => 1,
                            'translateX' => 100000,
                            'translateY' => 100000,
                            'unit' => 'EMU'
                        )
                    )
                )
            ));

        // Execute the request.
        $batchUpdateRequest = new Google_Service_Slides_BatchUpdatePresentationRequest(array(
            'requests' => $requests
        ));
        $response = $slidesService->presentations->batchUpdate($presentationId, $batchUpdateRequest);
        printf("Added a linked Sheets chart with ID: %s\n", $response->getPresentationId());
        return $response;
    } catch (Exception $e) {
        echo 'Message: ' . $e->getMessage();
    }
}

Python

slides/snippets/slides_create_sheets_chart.py
import google.auth
from googleapiclient.discovery import build
from googleapiclient.errors import HttpError


def create_sheets_chart(
    presentation_id, page_id, spreadsheet_id, sheet_chart_id
):
  """
  create_sheets_chart the user has access to.
  Load pre-authorized user credentials from the environment.
  TODO(developer) - See https://developers.google.com/identity
  for guides on implementing OAuth2 for the application.
  """
  creds, _ = google.auth.default()
  # pylint: disable=maybe-no-member
  try:
    slides_service = build("slides", "v1", credentials=creds)
    # Embed a Sheets chart (indicated by the spreadsheet_id and
    # sheet_chart_id) onto a page in the presentation.
    # Setting the linking mode as "LINKED" allows the
    # chart to be refreshed if the Sheets version is updated.

    emu4m = {"magnitude": 4000000, "unit": "EMU"}

    presentation_chart_id = "MyEmbeddedChart"
    requests = [
        {
            "createSheetsChart": {
                "objectId": presentation_chart_id,
                "spreadsheetId": spreadsheet_id,
                "chartId": sheet_chart_id,
                "linkingMode": "LINKED",
                "elementProperties": {
                    "pageObjectId": page_id,
                    "size": {"height": emu4m, "width": emu4m},
                    "transform": {
                        "scaleX": 1,
                        "scaleY": 1,
                        "translateX": 100000,
                        "translateY": 100000,
                        "unit": "EMU",
                    },
                },
            }
        }
    ]

    # Execute the request.
    body = {"requests": requests}
    response = (
        slides_service.presentations()
        .batchUpdate(presentationId=presentation_id, body=body)
        .execute()
    )
    print(f"Added a linked Sheets chart with ID: {presentation_chart_id}")
    return response
  except HttpError as error:
    print(f"An error occurred: {error}")
    return error


if __name__ == "__main__":
  # Put the presentation_id, Page_id of slides
  # spreadsheet_id and sheet_chart_id to be submitted.
  create_sheets_chart(
      "10QnVUx1X2qHsL17WUidGpPh_SQhXYx40CgIxaKk8jU4",
      "FIRSTSLIDE",
      "17eqFZl_WK4WVixX8PjvjfLD77DraoFwMDXeiHB3dvuM",
      "1107320627",
  )

Ruby

slides/snippets/lib/file_snippets.rb
# Embed a Sheets chart (indicated by the spreadsheet_id and sheet_chart_id) onto
# a page in the presentation. Setting the linking mode as "LINKED" allows the
# chart to be refreshed if the Sheets version is updated.
emu4M = {
  magnitude: 4000000,
  unit:      'EMU'
}
presentation_chart_id = 'my_embedded_chart'
requests = [{
  create_sheets_chart: {
    object_id_prop:     presentation_chart_id,
    spreadsheet_id:     spreadsheet_id,
    chart_id:           sheet_chart_id,
    linking_mode:       'LINKED',
    element_properties: {
      page_object_id: page_id,
      size:           {
        height: emu4M,
        width:  emu4M
      },
      transform:      {
        scale_x:     1,
        scale_y:     1,
        translate_x: 100000,
        translate_y: 100000,
        unit:        'EMU'
      }
    }
  }
}]

# Execute the request.
req = Google::Apis::SlidesV1::BatchUpdatePresentationRequest.new(requests: requests)
response = slides_service.batch_update_presentation(presentation_id, req)

puts "Added a linked Sheets chart with ID: #{presentation_chart_id}"

Grafiği yenileme

Sununuza LINKED grafiği yerleştirdiyseniz istediğiniz zaman RefreshSheetsChartRequest'i kullanarak bu grafiği yenileyebilirsiniz. Bu işlem, grafiği güncelleyerek temel E-Tablolar grafiği ve temel aldığı verilerle senkronize hale getirir.

Aşağıdaki örnek, mevcut bir grafiği yeniler:

Apps Komut Dosyası

slides/api/Snippets.gs
/**
 * Refresh the sheets charts
 * @param {string} presentationId
 * @param {string} presentationChartId
 * @returns {*}
 */
function refreshSheetsChart(presentationId, presentationChartId) {
  const requests = [{
    refreshSheetsChart: {
      objectId: presentationChartId
    }
  }];

  // Execute the request.
  try {
    const batchUpdateResponse = Slides.Presentations.batchUpdate({
      requests: requests
    }, presentationId);
    console.log('Refreshed a linked Sheets chart with ID: %s', presentationChartId);

    return batchUpdateResponse;
  } catch (err) {
    // TODO (Developer) - Handle exception
    console.log('Failed with error: %s', err.error);
  }
};

Go

slaytlar/snippet'ler/sunular.go
requests := []*slides.Request{{
	RefreshSheetsChart: &slides.RefreshSheetsChartRequest{
		ObjectId: presentationChartId,
	},
}}

// Execute the requests.
body := &slides.BatchUpdatePresentationRequest{Requests: requests}
response, _ := slidesService.Presentations.BatchUpdate(presentationId, body).Do()
fmt.Printf("Refreshed a linked Sheets chart with ID %s", presentationChartId)

Java

slides/snippets/src/main/java/RefreshSheetsChart.java
import com.google.api.client.googleapis.json.GoogleJsonError;
import com.google.api.client.googleapis.json.GoogleJsonResponseException;
import com.google.api.client.http.HttpRequestInitializer;
import com.google.api.client.http.javanet.NetHttpTransport;
import com.google.api.client.json.gson.GsonFactory;
import com.google.api.services.slides.v1.Slides;
import com.google.api.services.slides.v1.SlidesScopes;
import com.google.api.services.slides.v1.model.BatchUpdatePresentationRequest;
import com.google.api.services.slides.v1.model.BatchUpdatePresentationResponse;
import com.google.api.services.slides.v1.model.RefreshSheetsChartRequest;
import com.google.api.services.slides.v1.model.Request;
import com.google.auth.http.HttpCredentialsAdapter;
import com.google.auth.oauth2.GoogleCredentials;

import java.io.IOException;
import java.util.ArrayList;
import java.util.Collections;
import java.util.List;

/* Class to demonstrate the use of Slides Refresh Chart API */
public class RefreshSheetsChart {
  /**
   * Refresh the sheets charts.
   *
   * @param presentationId      - id of the presentation.
   * @param presentationChartId - id of the presentation chart.
   * @return presentation chart id
   * @throws IOException - if credentials file not found.
   */
  public static BatchUpdatePresentationResponse refreshSheetsChart(
      String presentationId, String presentationChartId) throws IOException {
        /* Load pre-authorized user credentials from the environment.
           TODO(developer) - See https://developers.google.com/identity for
            guides on implementing OAuth2 for your application. */
    GoogleCredentials credentials = GoogleCredentials.getApplicationDefault()
        .createScoped(Collections.singleton(SlidesScopes.PRESENTATIONS));
    HttpRequestInitializer requestInitializer = new HttpCredentialsAdapter(
        credentials);

    // Create the slides API client
    Slides service = new Slides.Builder(new NetHttpTransport(),
        GsonFactory.getDefaultInstance(),
        requestInitializer)
        .setApplicationName("Slides samples")
        .build();

    List<Request> requests = new ArrayList<>();

    // Refresh an existing linked Sheets chart embedded a presentation.
    requests.add(new Request()
        .setRefreshSheetsChart(new RefreshSheetsChartRequest()
            .setObjectId(presentationChartId)));

    BatchUpdatePresentationResponse response = null;
    try {
      // Execute the request.
      BatchUpdatePresentationRequest body =
          new BatchUpdatePresentationRequest().setRequests(requests);
      response = service.presentations().batchUpdate(presentationId, body).execute();
      System.out.println("Refreshed a linked Sheets chart with ID " + presentationChartId);
    } catch (GoogleJsonResponseException e) {
      // TODO(developer) - handle error appropriately
      GoogleJsonError error = e.getDetails();
      if (error.getCode() == 400) {
        System.out.printf("Presentation chart not found with id '%s'.\n", presentationChartId);
      } else if (error.getCode() == 404) {
        System.out.printf("Presentation not found with id '%s'.\n", presentationId);
      } else {
        throw e;
      }
    }
    return response;
  }
}

JavaScript

slides/snippets/slides_refresh_sheets_chart.js
function refreshSheetsChart(presentationId, presentationChartId, callback) {
  const requests = [{
    refreshSheetsChart: {
      objectId: presentationChartId,
    },
  }];
  // Execute the request.
  try {
    gapi.client.slides.presentations.batchUpdate({
      presentationId: presentationId,
      requests: requests,
    }).then((batchUpdateResponse) => {
      console.log(`Refreshed a linked Sheets chart with ID: ${presentationChartId}`);
      if (callback) callback(batchUpdateResponse.result);
    });
  } catch (err) {
    document.getElementById('content').innerText = err.message;
    return;
  }
}

Node.js

slides/snippets/slides_refresh_sheets_chart.js
/**
 * Refreshes an embedded sheet chart.
 * @param {string} presentationId The presentation ID.
 * @param {string} presentationChartId The presentation's chart ID.
 */
async function refreshSheetsChart(presentationId, presentationChartId) {
  const {GoogleAuth} = require('google-auth-library');
  const {google} = require('googleapis');

  const auth = new GoogleAuth({
    scopes: 'https://www.googleapis.com/auth/presentations',
  });

  const service = google.slides({version: 'v1', auth});

  const requests = [
    {
      refreshSheetsChart: {
        objectId: presentationChartId,
      },
    },
  ];

  // Execute the request.
  try {
    const batchUpdateResponse = await service.presentations.batchUpdate({
      presentationId,
      resource: {
        requests,
      },
    });
    console.log(
        `Refreshed a linked Sheets chart with ID: ${presentationChartId}`,
    );
    return batchUpdateResponse.data;
  } catch (err) {
    // TODO (developer) - Handle exception
    throw err;
  }
}

PHP

slides/snippets/src/SlidesRefreshSheetsChart.php
use Google\Client;
use Google\Service\Drive;
use Google\Service\Slides;
use Google\Service\Slides\BatchUpdatePresentationRequest;

function refreshSheetsChart($presentationId, $presentationChartId)
{
    /* Load pre-authorized user credentials from the environment.
       TODO(developer) - See https://developers.google.com/identity for
        guides on implementing OAuth2 for your application. */
    $client = new Google\Client();
    $client->useApplicationDefaultCredentials();
    $client->addScope(Google\Service\Drive::DRIVE);
    $slidesService = new Google_Service_Slides($client);
    try {

        $requests = array();
        $requests[] = new Google_Service_Slides_Request(array(
            'refreshSheetsChart' => array(
                'objectId' => $presentationChartId
            )
        ));

        // Execute the request.
        $batchUpdateRequest = new Google_Service_Slides_BatchUpdatePresentationRequest(array(
            'requests' => $requests
        ));
        $response = $slidesService->presentations->batchUpdate($presentationId, $batchUpdateRequest);
        printf("Refreshed a linked Sheets chart with ID: %s\n", $response->getPresentationId());
        return $response;
    } catch (Exception $e) {
        echo 'Message: ' . $e->getMessage();
    }
}

Python

slides/snippets/slides_refresh_sheets_chart.py
import google.auth
from googleapiclient.discovery import build
from googleapiclient.errors import HttpError


def refresh_sheets_chart(presentation_id, presentation_chart_id):
  """
  refresh_sheets_chart the user has access to.
  Load pre-authorized user credentials from the environment.
  TODO(developer) - See https://developers.google.com/identity
  for guides on implementing OAuth2 for the application.
  """
  creds, _ = google.auth.default()
  # pylint: disable=maybe-no-member
  try:
    slides_service = build("slides", "v1", credentials=creds)
    # Refresh an existing linked Sheets chart embedded in a presentation.
    requests = [{"refreshSheetsChart": {"objectId": presentation_chart_id}}]

    # Execute the request.
    body = {"requests": requests}
    response = (
        slides_service.presentations()
        .batchUpdate(presentationId=presentation_id, body=body)
        .execute()
    )
    print(f"Refreshed a linked Sheets chart with ID:{presentation_chart_id}")
    return response
  except HttpError as error:
    print(f"An error occurred: {error}")
    return error


if __name__ == "__main__":
  # Put the presentation_id, presentation_chart_id
  # to be submitted.
  refresh_sheets_chart(
      "10QnVUx1X2qHsL17WUidGpPh_SQhXYx40CgIxaKk8jU4", "1107320627"
  )

Ruby

slides/snippets/lib/file_snippets.rb
# Refresh an existing linked Sheets chart embedded in a presentation.
requests = [{
  refresh_sheets_chart: {
    object_id_prop: presentation_chart_id
  }
}]

# Execute the request.
req = Google::Apis::SlidesV1::BatchUpdatePresentationRequest.new(requests: requests)
response = slides_service.batch_update_presentation(presentation_id, req)

puts "Refreshed a linked Sheets chart with ID: #{presentation_chart_id}"