
Trang này mô tả cách lấy các biểu đồ hiện có từ Google Trang tính và thêm các biểu đồ đó vào bản trình bày trên Google Trang trình bày.
Việc thêm biểu đồ vào bản trình bày có thể giúp tạo ra tác động lớn hơn và giúp dữ liệu trở nên có ý nghĩa đối với khán giả. Biểu đồ là những công cụ mạnh mẽ và độc đáo để hiển thị các mẫu hoặc xu hướng trong một tập dữ liệu, đồng thời có thể giúp bạn truyền đạt rõ ràng về dữ liệu định lượng.
Video trên thảo luận về cách tạo trang trình bày từ dữ liệu bảng tính. Tài liệu này bao gồm một ví dụ hoàn chỉnh (Python) về cách thêm biểu đồ vào một trang trình bày, đồng thời nhập dữ liệu ô trong bảng tính vào một bảng.
Giới thiệu về cách thêm biểu đồ
Bất cứ khi nào bạn trình bày thông tin định lượng, biểu đồ dữ liệu có thể làm tăng hiệu quả của bản trình bày. API Trang trình bày cho phép bạn đưa bất kỳ biểu đồ nào mà bạn có thể tạo trong Google Trang tính: biểu đồ thanh, biểu đồ dạng đường, biểu đồ hình tròn và nhiều biểu đồ khác.
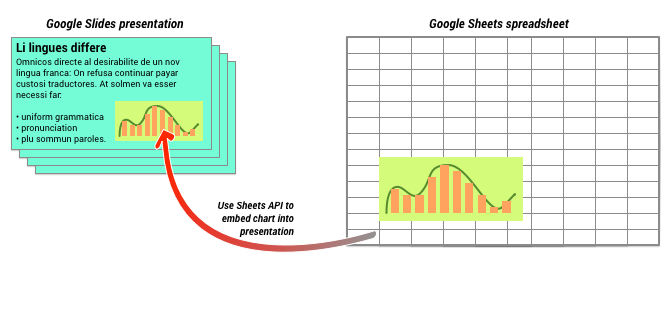
Như minh hoạ trong sơ đồ trên, trước tiên, bạn phải tạo biểu đồ trong Google Trang tính. Sau khi biểu đồ tồn tại, bạn có thể nhúng biểu đồ đó vào bản trình bày.
Quy trình chung để quản lý biểu đồ trong bản trình bày là:
- Tạo biểu đồ trong Google Trang tính.
- Sử dụng API Trang tính để đọc mã nhận dạng biểu đồ của EmbeddedChart thu được.
- Sử dụng CreateSheetsChartRequest một lần để thêm biểu đồ vào trang trình bày.
- Sử dụng RefreshSheetsChartRequest nếu cần để đồng bộ hoá với dữ liệu nguồn.
Biểu đồ tĩnh so với biểu đồ được liên kết
Khi sử dụng API để thêm biểu đồ vào bản trình bày, bạn sẽ chỉ định một tham số là LinkingMode. Điều này xác định xem biểu đồ được thêm dưới dạng hình ảnh tĩnh hay dưới dạng đối tượng có thể làm mới trong tương lai.
Sử dụng chế độ LINKED nếu:
- Bạn muốn làm mới biểu đồ trong tương lai để phản ánh các thay đổi trong dữ liệu cơ bản.
- Bạn muốn cộng tác viên có đường liên kết đến bảng tính chứa biểu đồ nguồn.
Sử dụng chế độ NOT_LINKED_IMAGE (tĩnh) nếu:
- Bạn muốn biểu đồ không bao giờ thay đổi trong tương lai.
- Bạn không muốn cộng tác viên thấy đường liên kết đến bảng tính nguồn.
Phạm vi truy cập vào Google Trang tính
Khi bạn thêm một biểu đồ vào trang trình bày, API Trang trình bày cần truy cập vào biểu đồ đó trong Google Trang tính. Điều này có nghĩa là yêu cầu của bạn phải sử dụng một trong các phạm vi sau:
https://www.googleapis.com/auth/spreadsheets.readonly(ưu tiên)https://www.googleapis.com/auth/spreadsheetshttps://www.googleapis.com/auth/drive.readonlyhttps://www.googleapis.com/auth/drive
Phạm vi spreadsheets.readonly thường là phạm vi tốt nhất để sử dụng vì phạm vi này có nhiều hạn chế nhất. Tuy nhiên, nếu ứng dụng của bạn đã sử dụng một trong các phạm vi khác được liệt kê ở trên, thì bạn chỉ cần sử dụng phạm vi đó.
Thêm biểu đồ
Để thêm biểu đồ, bạn cần biết mã nhận dạng bảng tính và mã nhận dạng biểu đồ của biểu đồ trong Google Trang tính. Sau đó, bạn gọi phương thức batchUpdate, sử dụng CreateSheetsChartRequest một lần để thêm biểu đồ.
Ví dụ sau đây lấy một biểu đồ và thêm biểu đồ đó vào một trang trình bày dưới dạng LINKED để có thể làm mới biểu đồ đó sau.
Apps Script
Go
Java
JavaScript
Node.js
PHP
Python
Ruby
Làm mới biểu đồ
Nếu đã nhúng biểu đồ LINKED vào bản trình bày, thì bạn có thể làm mới biểu đồ đó bất cứ lúc nào bằng cách sử dụng RefreshSheetsChartRequest.
Thao tác này sẽ cập nhật biểu đồ để đồng bộ hoá với biểu đồ cơ bản trên Trang tính và dữ liệu mà biểu đồ đó dựa trên.
Ví dụ sau đây làm mới một biểu đồ hiện có: