Page Summary
-
This documentation details the deprecated PageSpeed Insights API version 4, which will be shut down; developers should use the latest version 5.
-
The API enables programmatic access to PageSpeed scores, optimization scores, and performance suggestions for web pages.
-
Developers need a Google Account and API key to use the PageSpeed Insights API for authentication purposes.
-
The API provides data such as Loading Experience, Page Stats, Optimization Score, and detailed Rule Results with impact values for improvement suggestions.
-
It can be invoked from the command line using tools like
curlor within JavaScript using a callback function for JSON-P results.
Introduction
This document is intended for developers who want to write applications that can interact with the PageSpeed Insights API.
PageSpeed Insights is a tool that reports on the real-world performance of a page for mobile and desktop devices and provides suggestions on how that page may be improved to helps developer to optimize their web pages. You can use the PageSpeed Insights API to programmatically generate PageSpeed speed score, optimization score and suggestions..
Before you start
Get a Google Account
You need to have a Google Account so you can get an API key to identify your application to Google. (See below.)
Get familiar with PageSpeed
If you're unfamiliar with PageSpeed, see the PageSpeed Web Performance Best Practices.
Learn how to identify your application to Google
Your application needs to identify itself every time it sends a request to the PageSpeed Insights API, by including an API key with each request.
Acquiring and using an API key
Get a KeyOr create one in the Credentials page.
After you have an API key, your application can append the query parameter
key=yourAPIKey to all request URLs.
The API key is safe for embedding in URLs; it doesn't need any encoding.
PageSpeed Insights API background
The results returned by the PageSpeed Insights API include the following types of information:
- Loading Experience
- The Loading Experience section includes an overall speed category (FAST, AVERAGE or SLOW) and cateogry distributions.
- Page Stats
- The Page Stats section contains some useful statistical results like the round trips required and the total bytes used. It indicates that if the page might be faster by modifying the appearance and functionality.
- Optimization Score
- The PageSpeed Optimization Score (0-100) indicates how well optimized a page is. A high score indicates little room for improvement, while a low score indicates more room for improvement.
- Rule
- PageSpeed analyzes web pages using rules. Each PageSpeed rule is based on general principles of web page performance, such as resource caching, data upload and download size, and client-server round-trip times. PageSpeed rules generate rule results and rule impacts, described below.
- Rule Result
- A rule result is a suggestion generated by a rule that, if implemented, would make the page faster and increase the PageSpeed score for that page. For instance, if a compressible resource is served uncompressed, the PageSpeed Enable Compression rule would generate a result that recommends that the developer enable compression for that resource.
- Rule Impact
- Each PageSpeed rule generates an impact number (an unbounded floating point value) that indicates the importance or priority of implementing the rule-result suggestions for the rule, relative to other rules. For instance, if enabling compression would save 1MB, while optimizing images would save 500kB, the Enable Compression rule would have an impact value that is twice that of the Optimize Images rule. An impact of zero indicates that there are no suggestions for improvement for that rule.
Invoking the API
To invoke the API, call the runPagespeed method, specifying the URL, API key, and other parameters in the query string. Refer to the API Reference documents for more details.
Example API calls
From the command line
You can invoke the PageSpeed Insights API from the Linux/UNIX command line, using a program such as curl.
The following example uses this approach to fetch mobile PageSpeed results for the URL https://developers.google.com/speed/pagespeed/insights/. The PageSpeed score, page statistics, and PageSpeed formatted results are returned in the JSON data format.
Formatted results are keyed by rule identifiers (such as AvoidBadRequests or MinifyJavaScript), and contain the score and impact for that rule, as well as suggestions generated by the rule that, if implemented, will make the page load faster. To learn more about the fields in the JSON response, see the PageSpeed Insights API Reference document.
Request:
$ curl 'https://www.googleapis.com/pagespeedonline/v4/runPagespeed?url=https://developers.google.com/speed/pagespeed/insights/&strategy=mobile&key=yourAPIKey'
Response:
{
 "captchaResult": "CAPTCHA_NOT_NEEDED",
 "kind": "pagespeedonline#result",
 "id": "https://developers.google.com/speed/pagespeed/insights/",
 "responseCode": 200,
 "title": "PageSpeed Insights",
 "ruleGroups": {
  "SPEED": {
   "score": 99
  }
 },
 "loadingExperience": {
  "id": "https://developers.google.com/speed/pagespeed/insights/",
  "metrics": {
   "FIRST_CONTENTFUL_PAINT_MS": {
    "median": 678,
    "distributions": [
     {
      "min": 0,
      "max": 1567,
      "proportion": 0.8726942914078067
     },
     {
      "min": 1567,
      "max": 2963,
      "proportion": 0.07357226585394444
     },
     {
      "min": 2963,
      "proportion": 0.053733442738248746
     }
    ],
    "category": "FAST"
   },
   "DOM_CONTENT_LOADED_EVENT_FIRED_MS": {
    "median": 559,
    "distributions": [
     {
      "min": 0,
      "max": 2120,
      "proportion": 0.9287991742172268
     },
     {
      "min": 2120,
      "max": 4226,
      "proportion": 0.035877050120426655
     },
     {
      "min": 4226,
      "proportion": 0.0353237756623466
     }
    ],
    "category": "FAST"
   }
  },
  "overall_category": "FAST",
  "initial_url": "https://developers.google.com/speed/pagespeed/insights/"
 },
 "pageStats": {
  "numberResources": 11,
  "numberHosts": 6,
  "totalRequestBytes": "1874",
  "numberStaticResources": 6,
  "htmlResponseBytes": "72494",
  "overTheWireResponseBytes": "324002",
  "cssResponseBytes": "8467",
  "imageResponseBytes": "5363",
  "javascriptResponseBytes": "841488",
  "otherResponseBytes": "14548",
  "numberJsResources": 4,
  "numberCssResources": 1,
  "numTotalRoundTrips": 13,
  "numRenderBlockingRoundTrips": 0
 },
 "formattedResults": {
  "locale": "en_US",
  "ruleResults": {
   "AvoidLandingPageRedirects": {
    "localizedRuleName": "Avoid landing page redirects",
    "ruleImpact": 0.0,
    "groups": [
     "SPEED"
    ],
    "summary": {
     "format": "Your page has no redirects. Learn more about {{BEGIN_LINK}}avoiding landing page redirects{{END_LINK}}.",
     "args": [
      {
       "type": "HYPERLINK",
       "key": "LINK",
       "value": "https://developers.google.com/speed/docs/insights/AvoidRedirects"
      }
     ]
    }
   },
   "EnableGzipCompression": {
    "localizedRuleName": "Enable compression",
    "ruleImpact": 0.0,
    "groups": [
     "SPEED"
    ],
    "summary": {
     "format": "You have compression enabled. Learn more about {{BEGIN_LINK}}enabling compression{{END_LINK}}.",
     "args": [
      {
       "type": "HYPERLINK",
       "key": "LINK",
       "value": "https://developers.google.com/speed/docs/insights/EnableCompression"
      }
     ]
    }
   },
   ...
   "PrioritizeVisibleContent": {
    "localizedRuleName": "Prioritize visible content",
    "ruleImpact": 0.0,
    "groups": [
     "SPEED"
    ],
    "summary": {
     "format": "You have the above-the-fold content properly prioritized. Learn more about {{BEGIN_LINK}}prioritizing visible content{{END_LINK}}.",
     "args": [
      {
       "type": "HYPERLINK",
       "key": "LINK",
       "value": "https://developers.google.com/speed/docs/insights/PrioritizeVisibleContent"
      }
     ]
    }
   }
  }
 },
 "version": {
  "major": 1,
  "minor": 15
 }
}
From JavaScript
You can invoke the PageSpeed Insights API from JavaScript in the browser, using the callback query parameter and a callback function to generate JSON-P results. This allows you to write rich applications that display PageSpeed data without writing any server-side code.
The following example uses this approach to display PageSpeed results and other information for the URL https://developers.google.com/speed/pagespeed/insights/. This example also makes use of the Google Chart Tools to visualize the information generated by the PageSpeed Insights API.
First, specify your Google API key (learn more about API keys):
<script>
// Specify your actual API key here:
var API_KEY = 'yourAPIKey';

// Specify the URL you want PageSpeed results for here:
var URL_TO_GET_RESULTS_FOR = 'https://developers.google.com/speed/pagespeed/insights/';
</script>
Next, fetch PageSpeed Results from the PageSpeed Insights API:
<script>
var API_URL = 'https://www.googleapis.com/pagespeedonline/v4/runPagespeed?';
var CHART_API_URL = 'http://chart.apis.google.com/chart?';

// Object that will hold the callbacks that process results from the
// PageSpeed Insights API.
var callbacks = {}

// Invokes the PageSpeed Insights API. The response will contain
// JavaScript that invokes our callback with the PageSpeed results.
function runPagespeed() {
  var s = document.createElement('script');
  s.type = 'text/javascript';
  s.async = true;
  var query = [
    'url=' + URL_TO_GET_RESULTS_FOR,
    'callback=runPagespeedCallbacks',
    'key=' + API_KEY,
  ].join('&');
  s.src = API_URL + query;
  document.head.insertBefore(s, null);
}

// Our JSONP callback. Checks for errors, then invokes our callback handlers.
function runPagespeedCallbacks(result) {
  if (result.error) {
    var errors = result.error.errors;
    for (var i = 0, len = errors.length; i < len; ++i) {
      if (errors[i].reason == 'badRequest' && API_KEY == 'yourAPIKey') {
        alert('Please specify your Google API key in the API_KEY variable.');
      } else {
        // NOTE: your real production app should use a better
        // mechanism than alert() to communicate the error to the user.
        alert(errors[i].message);
      }
    }
    return;
  }

  // Dispatch to each function on the callbacks object.
  for (var fn in callbacks) {
    var f = callbacks[fn];
    if (typeof f == 'function') {
      callbacks[fn](result);
    }
  }
}

// Invoke the callback that fetches results. Async here so we're sure
// to discover any callbacks registered below, but this can be
// synchronous in your code.
setTimeout(runPagespeed, 0);
</script>
Using the code above to fetch results from the PageSpeed Insights API, we're now ready to display interesting information in the user's browser using the examples below.
Example 1: Display top PageSpeed suggestions
This example displays the names of the top PageSpeed suggestions for the page being analyzed, as an unordered list. For example:
- Leverage browser caching
- Defer parsing of JavaScript
- Minify HTML
- Minify JavaScript
Note: The data needed to display full PageSpeed results is provided by the PageSpeed Insights API, but in order to keep the example simple, not all of that data is used here.
<script>
callbacks.displayTopPageSpeedSuggestions = function(result) {
  var results = [];
  var ruleResults = result.formattedResults.ruleResults;
  for (var i in ruleResults) {
    var ruleResult = ruleResults[i];
    // Don't display lower-impact suggestions.
    if (ruleResult.ruleImpact < 3.0) continue;
    results.push({name: ruleResult.localizedRuleName,
                  impact: ruleResult.ruleImpact});
  }
  results.sort(sortByImpact);
  var ul = document.createElement('ul');
  for (var i = 0, len = results.length; i < len; ++i) {
    var r = document.createElement('li');
    r.innerHTML = results[i].name;
    ul.insertBefore(r, null);
  }
  if (ul.hasChildNodes()) {
    document.body.insertBefore(ul, null);
  } else {
    var div = document.createElement('div');
    div.innerHTML = 'No high impact suggestions. Good job!';
    document.body.insertBefore(div, null);
  }
};

// Helper function that sorts results in order of impact.
function sortByImpact(a, b) { return b.impact - a.impact; }
</script>
Example 2: Display a resource size breakdown pie chart
This example displays a pie chart that shows the resource size breakdown of the page being analyzed. For example:
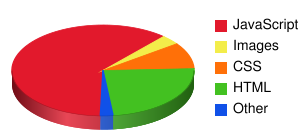
<script>
var RESOURCE_TYPE_INFO = [
  {label: 'JavaScript', field: 'javascriptResponseBytes', color: 'e2192c'},
  {label: 'Images', field: 'imageResponseBytes', color: 'f3ed4a'},
  {label: 'CSS', field: 'cssResponseBytes', color: 'ff7008'},
  {label: 'HTML', field: 'htmlResponseBytes', color: '43c121'},
  {label: 'Flash', field: 'flashResponseBytes', color: 'f8ce44'},
  {label: 'Text', field: 'textResponseBytes', color: 'ad6bc5'},
  {label: 'Other', field: 'otherResponseBytes', color: '1051e8'},
];

callbacks.displayResourceSizeBreakdown = function(result) {
  var stats = result.pageStats;
  var labels = [];
  var data = [];
  var colors = [];
  var totalBytes = 0;
  var largestSingleCategory = 0;
  for (var i = 0, len = RESOURCE_TYPE_INFO.length; i < len; ++i) {
    var label = RESOURCE_TYPE_INFO[i].label;
    var field = RESOURCE_TYPE_INFO[i].field;
    var color = RESOURCE_TYPE_INFO[i].color;
    if (field in stats) {
      var val = Number(stats[field]);
      totalBytes += val;
      if (val > largestSingleCategory) largestSingleCategory = val;
      labels.push(label);
      data.push(val);
      colors.push(color);
    }
  }
  // Construct the query to send to the Google Chart Tools.
  var query = [
    'chs=300x140',
    'cht=p3',
    'chts=' + ['000000', 16].join(','),
    'chco=' + colors.join('|'),
    'chd=t:' + data.join(','),
    'chdl=' + labels.join('|'),
    'chdls=000000,14',
    'chp=1.6',
    'chds=0,' + largestSingleCategory,
  ].join('&');
  var i = document.createElement('img');
  i.src = 'http://chart.apis.google.com/chart?' + query;
  document.body.insertBefore(i, null);
};
</script>
Demo Video
PageSpeed Insights API demo at Google I/O BootCamp 2011.