
В этом документе описывается, как создавать радиолокационные диаграммы с помощью Chart API.
Оглавление
Особенности диаграммы
| Стандартные функции
|
Обзор
На лепестковой диаграмме точки данных рисуются равномерно по часовой стрелке вокруг диаграммы. Значение точки представляется как расстояние от центра диаграммы, где центр представляет собой минимальное значение, а край диаграммы — максимальное значение. Каждая серия рисуется как одна полная схема диаграммы. Диаграмма соединяет эти точки прямыми или изогнутыми линиями по вашему усмотрению. Итак, радиолокационная диаграмма — это, по сути, линейная диаграмма, заключенная в круг, где ось Y проходит от центра диаграммы к периметру, а ось X — это периметр диаграммы, начиная и заканчивая цифрой 12: 00 строка.
Диаграмма равномерно разделена на равные сегменты; количество сегментов равно большему из этих двух значений:
- количество меток + 1 (как указано в
chxl, если присутствует) или - количество значений данных.
Так, например, если у вас есть диаграмма с восемью точками данных и без меток, точки данных будут расположены на расстоянии 45 градусов друг от друга (360/8).
Если у вас несколько серий, засчитывается серия, набравшая наибольшее количество очков. Минимальное количество сегментов — четыре; если у вас меньше четырех меток или точек данных, диаграмма по умолчанию будет состоять из четырех сегментов. Чтобы составить полную схему диаграммы, вам понадобится n+1 точек данных, где n — количество сегментов. Больше точек данных повысит детализацию диаграммы. Ваши данные никогда не будут обойти диаграмму более одного раза.
.Радарная диаграмма может поддерживать несколько серий. Каждая серия представляет собой линию на графике.
| Описание | Пример |
|---|---|
На диаграмме типа В этом примере показана простая радиолокационная диаграмма с одним рядом данных. Значения постепенно увеличиваются, что дает вид раковины улитки. |
|
| Если метки оси X включены в лепестковую диаграмму, расстояние между точками данных вокруг диаграммы определяется количеством меток или количеством точек данных, в зависимости от того, что больше. На обеих этих диаграммах количество точек данных одинаковое (пять), но на первой меньше меток, а на второй больше меток. На первой диаграмме местоположения данных назначаются в соответствии с количеством точек данных, а на второй — в соответствии с количеством меток. Обратите внимание, что второй график состоит из шести сегментов, что дает семь точек для формирования полного круга. |
|
Вы можете добавить дополнительную информацию и ясность на радиолокационную диаграмму, добавив цвета, стили линий и метки осей. Этот пример представляет собой более сложную радиолокационную диаграмму с двумя рядами данных. Цвет каждой серии данных задается с помощью Стили линий задаются с помощью Метки осей задаются с помощью |  chco=FF0000,FF9900 |
На диаграммах типа В этом примере используются те же параметры, что и в предыдущем примере, но для обоих рядов данных указана заливка строк . Этот пример включает линии сетки . |  chg=25.0,25.0,4.0,4.0 |
На радиолокационных диаграммах горизонтальные линейные маркеры изогнуты в круги, а вертикальные линейные маркеры расходятся наружу от центра, как показано здесь.
Дополнительные сведения о доступных фигурах см. в разделе Маркеры фигур . |  chm= |


Типы диаграмм ( cht )
Существует два типа радиолокационных диаграмм: прямолинейные диаграммы ( cht=r ) и криволинейные диаграммы ( cht=rs ).
| Параметр | Описание | Пример |
|---|---|---|
r | На диаграмме типа |
|
rs | Тип диаграммы rs соединяет точки изогнутыми линиями. |  cht=rs |

Серия Цвета chco
При необходимости укажите цвета линий с помощью параметра chco .
Синтаксис
chco=<color_1>,...,<color_n>
- < цвет >
- Укажите один или несколько цветов линий в шестнадцатеричном формате RRGGBB , разделенных запятыми. Если строк больше, чем цветов, дополнительные строки будут циклически проходить по списку цветов с самого начала.
Стандартные функции
Остальные функции на этой странице являются стандартными функциями диаграмм.
Название графика chtt , chts [ Все графики ]
Вы можете указать текст заголовка, цвет и размер шрифта для диаграммы.
Синтаксис
chtt=<chart_title>
chts=<color>,<font_size>,<opt_alignment>
chtt — указывает заголовок диаграммы.
- < название_диаграммы >
- Название для отображения диаграммы. Вы не можете указать, где это будет отображаться, но при желании вы можете указать размер и цвет шрифта. Используйте знак + для обозначения пробелов и символ вертикальной черты (
|) для обозначения разрывов строк.
chts [ Необязательно ] — цвета и размер шрифта для параметра chtt .
- <цвет >
- Цвет заголовка в шестнадцатеричном формате RRGGBB . Цвет по умолчанию — черный.
- <размер_шрифта >
- Размер шрифта заголовка, в пунктах.
- <opt_alignment>
- [ Необязательно ] Выравнивание заголовка. Выберите одно из следующих строковых значений с учетом регистра: «l» (слева), «c» (по центру), «r» (справа). По умолчанию — «с».
Примеры
| Описание | Пример |
|---|---|
Диаграмма с заголовком, использующая цвет и размер шрифта по умолчанию. Укажите пробел со знаком плюс ( Используйте символ вертикальной черты ( |  chtt=Site+visitors+by+month| |
Диаграмма с синим заголовком размером 20 пунктов, выровненным по правому краю. |  chtt=Site+visitors |
Текст и стиль легенды диаграммы chdl , chdlp , chdls [ Все диаграммы ]
Легенда — это боковая часть диаграммы, содержащая небольшое текстовое описание каждой серии. Вы можете указать текст, связанный с каждой серией в этой легенде, и указать, где на диаграмме он должен появиться.
См. также chma , чтобы узнать, как установить поля вокруг легенды.
Примечание о строковых значениях: в строках меток разрешены только символы, безопасные для URL. В целях безопасности вам следует закодировать URL-адресом все строки, содержащие символы, не входящие в набор символов 0-9a-zA-Z . Кодировщик URL-адресов можно найти в документации по визуализации Google .
Синтаксис
chdl=<data_series_1_label>|...|<data_series_n_label>
chdlp=<opt_position>|<opt_label_order>
chdls=<color>,<size>
chdl — текст каждой серии для отображения в легенде.
- < метка_серии_данных >
- Текст для записей легенды. Каждая метка применяется к соответствующей серии в массиве
chd. Используйте знак + для пробела. Если вы не укажете этот параметр, на диаграмме не будет легенды. Невозможно указать разрыв строки в метке. Легенда обычно расширяется, чтобы вместить текст легенды, а область диаграммы сжимается, чтобы вместить легенду.
chdlp — [ необязательно ] Положение легенды и порядок записей легенды. Вы можете указать <position> и/или <label_order> . Если вы укажете оба, разделите их чертой. Вы можете добавить «s» к любому значению, если хотите, чтобы пустые записи легенды в chdl были пропущены в легенде. Примеры: chdlp=bv , chdlp=r , chdlp=bv|r , chdlp=bvs|r
- < опт_позиция >
- [ Необязательно ] Указывает положение легенды на диаграмме. Чтобы указать дополнительное отступы между легендой и областью диаграммы или границей изображения, используйте параметр
chma. Выберите одно из следующих значений:-
b– Легенда внизу диаграммы, записи легенды расположены в горизонтальном ряду. -
bv— легенда внизу диаграммы, записи легенды в вертикальном столбце. -
t— Легенда вверху диаграммы, записи легенды расположены в горизонтальном ряду. -
tv— Легенда вверху диаграммы, записи легенды в вертикальном столбце. -
r— [ по умолчанию ] Легенда справа от диаграммы, записи легенды в вертикальном столбце. -
l— легенда слева от диаграммы, записи легенды в вертикальном столбце.
-
- <opt_label_order>
- [ Необязательно ] Порядок отображения меток в легенде. Выберите одно из следующих значений:
-
l[ По умолчанию для вертикальных легенд ] Отображать метки в порядке, указанном вchdl. -
r— отображать метки в порядке, обратном заданномуchdl. Это полезно в составных гистограммах, чтобы показать легенду.
в том же порядке, в котором появляются полосы. -
a— [ По умолчанию для горизонтальных легенд ] Автоматическое упорядочение: примерно означает сортировку по длине, сначала самый короткий, измеряемый в блоках по 10 пикселей. Если два элемента имеют одинаковую длину (разделены на блоки по 10 пикселей), первым будет отображаться тот, который указан первым. -
0,1,2...— Пользовательский порядок меток. Это список индексов меток, отсчитываемых от нуля, изchdl, разделенных запятыми.
-
chdls — [ необязательно ] Задает цвет и размер шрифта текста легенды.
- < цвет >
- Цвет текста легенды в шестнадцатеричном формате RRGGBB .
- < размер >
- Размер пункта текста легенды.
Примеры
| Описание | Пример |
|---|---|
Два примера легенд. Укажите текст легенды в том же порядке, что и ряд данных. |
chdl=NASDAQ|FTSE100|DOW
chdl=First|Second|Third |
На первой диаграмме показаны записи горизонтальной легенды ( |
|
| В этом примере показано изменение размера шрифта. |
|


Поля диаграммы chma [ Все диаграммы ]
Вы можете указать размер полей диаграммы в пикселях. Поля рассчитываются внутрь от указанного размера диаграммы ( chs ); Увеличение размера поля не увеличивает общий размер диаграммы, а, при необходимости, уменьшает ее область.
Поля по умолчанию — это все, что осталось после расчета размера диаграммы. Это значение по умолчанию зависит от типа диаграммы. Указанные вами поля являются минимальным значением; если в области диаграммы остается место для полей, размер поля будет таким же, как и оставшееся; вы не можете сжимать поля меньше, чем требуется для любых легенд и надписей. Вот диаграмма, показывающая основные части диаграммы:
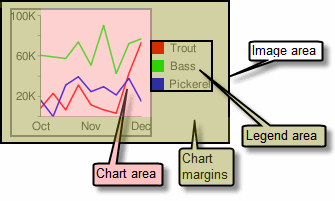 | Поля диаграммы включают метки осей и область легенды . Размер области легенды изменяется автоматически, чтобы точно соответствовать тексту, если только вы не укажете большую ширину с помощью Совет: Если в гистограмме столбцы имеют фиксированный размер (по умолчанию), ширину области диаграммы нельзя уменьшить. Вы должны указать меньший или изменяемый размер полосы с помощью |
Синтаксис
chma=
  <left_margin>,<right_margin>,<top_margin>,<bottom_margin>|<opt_legend_width>,<opt_legend_height>
- < левое_поле >, < правое_поле >, < верхнее_поле >, < нижнее_поле >
- Минимальный размер поля вокруг области диаграммы в пикселях. Увеличьте это значение, чтобы включить некоторые отступы, чтобы метки осей не сталкивались с границами диаграммы.
- <opt_legend_width> , <opt_legend_height>
- [ Необязательно ] Ширина поля вокруг легенды в пикселях. Используйте это, чтобы легенда не сталкивалась с областью диаграммы или краями изображения.
Примеры
| Описание | Пример |
|---|---|
В этом примере диаграмма имеет минимальное поле в 30 пикселей с каждой стороны. Поскольку ширина легенды диаграммы превышает 30 пикселей, поле справа устанавливается на ширину легенды диаграммы и отличается от других полей. Метки осей находятся за пределами области графика и поэтому рисуются внутри поля. |
|
Чтобы добавить поле вокруг легенды, установите значение для параметров В этом примере ширина легенды составляет примерно 60 пикселей. Если вы установите для |
|


Стили и метки осей [ линия, полоса, Google-o-meter, радар, рассеяние ]
Вы можете указать, какие оси отображать на диаграмме, и присвоить им собственные метки и позиции, диапазоны и стили.
Не на всех диаграммах по умолчанию отображаются линии осей. Вы можете точно указать, какие оси должна отображать ваша диаграмма, используя параметр chxt . На линиях оси по умолчанию не отображаются числа; вы должны указать ось в параметре chxt , чтобы отображать числа.
Вы можете выбрать, чтобы на ваших осях отображались числа, отражающие значения данных, или вы можете указать собственные оси. По умолчанию отображаются числовые значения в диапазоне от 0 до 100. Однако вы можете изменить этот диапазон с помощью chxr для отображения любого диапазона, а также стилизовать значения (например, для отображения символов валюты или десятичных знаков) с помощью chxs .
Если вы решите использовать пользовательские значения, например: «Пн, вторник, среда», вы можете использовать параметр chxl . Чтобы разместить эти метки в определенных местах вдоль оси, используйте параметр chxp .
Наконец, вы можете использовать параметры chxs и chxtc для указания цвета, размера, выравнивания и других свойств как пользовательских, так и числовых меток осей.
Примечание о строковых значениях: в строках меток разрешены только символы, безопасные для URL. В целях безопасности вам следует закодировать URL-адресом все строки, содержащие символы, не входящие в набор символов 0-9a-zA-Z . Кодировщик URL-адресов можно найти в документации по визуализации Google .
В этом разделе рассматриваются следующие темы:
- Видимые оси (
chxt) — какие оси отображать. - Диапазон оси (
chxr) — диапазон значений для каждой оси. - Пользовательские метки осей (
chxl) — пользовательские значения для отображения на оси. - Позиции меток по осям (
chxp) — размещение пользовательских меток вдоль каждой оси. - Стили меток осей (
chxs) — цвет, размер, выравнивание и форматирование меток осей. - Стили делений оси (
chxtc) — длина делений для определенной оси.
Видимые оси chxt
Гистограммы, линейные, лепестковые и точечные диаграммы по умолчанию отображают одну или две оси, но эти линии не содержат значений. Чтобы отобразить значения на линиях осей или изменить отображаемые оси, вы должны использовать параметр chxt . По умолчанию значения осей находятся в диапазоне от 0 до 100, если вы не масштабируете их явно с помощью свойства chxr . Чтобы скрыть все линии осей на линейной диаграмме, укажите :nda после значения типа диаграммы в параметре cht (пример: cht= lc:nda ).
По умолчанию на верхней и нижней осях не отображаются деления значений, а на левой и правой осях они отображаются. Вы можете изменить это поведение, используя параметр chxs .
Синтаксис
chxt=
  <axis_1>
    ,...,
  <axis_n>
- < ось >
- Ось для отображения на диаграмме. Доступные оси:
-
x— нижняя ось X -
t– верхняя ось X [ не поддерживается Google-o-Meter ] -
y— левая ось Y -
r— правая ось Y [ не поддерживается Google-o-Meter ]
-
Вы можете указать несколько осей одного типа, например: cht=x,x,y . Это объединит два набора осей X в нижней части диаграммы. Это полезно при добавлении пользовательских меток вдоль оси, отображающей числовые значения (см. пример ниже). Оси рисуются изнутри наружу, поэтому, если у вас есть x,x , первый x относится к самой внутренней копии, следующий x относится к следующей внешней копии и так далее.
Примеры
| Описание | Пример |
|---|---|
В этом примере показана линейная диаграмма с осями X, Y, верхней осью (t) и правой осью (r). Поскольку метки не указаны, по умолчанию для диаграммы используется диапазон от 0 до 100 для всех осей. Обратите внимание, что по умолчанию верхняя и нижняя оси не имеют меток рядом с метками. |
|
Вы можете включить несколько наборов меток для каждой оси, включив одно и то же значение несколько раз. В этом примере показаны два набора осей x и два набора осей y. Это не особенно полезно при использовании только меток осей по умолчанию, как показано здесь. Но вы можете указать собственные метки для каждой копии каждой оси, используя параметр chxl . |
|
В этом примере показана горизонтальная гистограмма с осью X, осью Y, верхней осью T и правой осью R. Метки осей опущены, поэтому API диаграмм отображает диапазон от 0 до 100 для оси X и для оси T. Диапазон по оси Y и по оси R определяется количеством столбцов. В данном случае имеется пять столбцов, поэтому API диаграмм отображает диапазон от 0 до 4. Первая метка располагается по центру основания первого столбца, вторая метка — по центру основания второго столбца и т. д. . |
|
Вы можете отключить оси по умолчанию в линейной диаграмме, указав :nda после типа диаграммы. |  cht=lc:nda |

 chxt=x,x,y,y
  chxt=x,x,y,y
Диапазон оси chxr
Вы можете указать диапазон значений, которые отображаются на каждой оси независимо, используя параметр chxr. Обратите внимание, что это не меняет масштаб элементов диаграммы, а только масштаб меток осей. Если вы хотите, чтобы номера осей описывали фактические значения данных, установите <start_val> и <end_val> в нижнее и верхнее значения диапазона вашего формата данных соответственно. См. «Масштабирование оси» для получения дополнительной информации.
Вы должны сделать ось видимой с помощью параметра chxt , если хотите указать ее диапазон.
Чтобы указать значения настраиваемой оси, используйте параметр chxl .
Синтаксис
Разделите диапазоны меток нескольких осей с помощью вертикальной черты ( | ).
chxr=
  <axis_index>,<start_val>,<end_val>,<opt_step>
    |...|
  <axis_index>,<start_val>,<end_val>,<opt_step>
- <индекс_оси >
- К какой оси применять метки. Это индекс, начинающийся с нуля, в массиве осей, заданном
chxt. Например, ось r будет равна 1 вchxt=x,r,y. - < начальное_значение >
- Число, определяющее нижнее значение для этой оси.
- < конечное_значение >
- Число, определяющее максимальное значение для этой оси.
- <opt_step>
- [ Необязательно ] Шаг отсчета между делениями на оси. Не существует значения шага по умолчанию; шаг рассчитан так, чтобы попытаться показать набор хорошо расположенных меток.
Примеры
| Описание | Пример |
|---|---|
В этом примере показаны левая и правая оси Y ( Каждая ось имеет определенный диапазон. Поскольку метки или позиции не указаны, значения берутся из заданного диапазона и равномерно распределяются внутри этого диапазона. На линейном графике значения равномерно распределены по оси X. Направление оси меняется на противоположное для оси r (индекс |
|
В этом примере значения указаны для оси X. Метки осей равномерно расположены вдоль оси. Для параметра <opt_step> указано значение пять ( |
|


Пользовательские метки осей chxl
Вы можете указать собственные метки строковых осей на любой оси, используя параметр chxl . Вы можете указать столько ярлыков, сколько захотите. Если вы отображаете ось (с помощью параметра chxt ) и не указываете пользовательские метки, будут применены стандартные числовые метки. Чтобы указать пользовательский числовой диапазон, используйте вместо этого параметр chxr .
Чтобы установить определенные местоположения на оси для ваших меток, используйте параметр chxp .
Синтаксис
Укажите один набор параметров для каждой оси, которую вы хотите пометить. Разделите несколько наборов меток с помощью вертикальной черты ( | ).
chxl=
  <axis_index>:|<label_1>|...|<label_n>
    |...|
  <axis_index>:|<label_1>|...|<label_n>
- <индекс_оси >
- К какой оси применять метки. Это индекс массива параметров
chxt. Например, если у вас естьchxt=x,x,y,yто индекс 0 будет первой осью X, а 1 — второй осью X. - <метка_1> | ... |< метка_n >
- Одна или несколько меток, которые можно разместить вдоль этой оси. Это могут быть строковые или числовые значения; строки не обязательно должны быть в кавычках. label_1 отображается в самой нижней позиции на оси, а label_n отображается в самой высокой позиции. Дополнительные метки располагаются между ними равномерно. Пробелы обозначайте знаком +. Невозможно указать разрыв строки в метке. Отдельные метки с помощью вертикальной черты. Примечание. Не размещайте трубку после последней метки в параметре
chxl.
Примеры
| Описание | Пример |
|---|---|
На этой диаграмме показано, как добавлять пользовательские метки к двум осям. Обратите внимание, что значения расположены равномерно и что последнее значение |  chxt=x,y |
Этот пример включает метки осей на левой и правой осях Y ( |
|
Этот пример включает метки осей на левой и правой осях Y ( В этом примере используются значения по умолчанию для меток оси на левой оси Y. |
|
Если вы хотите добавить общую метку для описания всей оси (например, чтобы пометить одну ось «стоимость», а другую — «студент»), используйте свойство |  chxt=x,x,y,y |


Позиции меток осей chxp
Вы можете указать, какие метки осей отображать, используя метки по умолчанию или пользовательские метки, заданные с помощью chxl . Если вы не укажете точные позиции с помощью этого параметра, метки будут располагаться равномерно и со значением шага по умолчанию вдоль осей. Если вы не укажете chxl , метки делений будут значениями по умолчанию (обычно значениями данных или номерами столбцов в гистограммах).
Синтаксис
Разделите несколько наборов позиционирования с помощью вертикальной черты ( | ).
chxp=
  <axis_1_index>,<label_1_position>,...,<label_n_position>
    |...|
  <axis_m_index>,<label_1_position>,...,<label_n_position>
- <индекс_оси >
- Ось, для которой вы указываете позиции. Это индекс массива параметров
chxt. Например, если у вас естьchxt=x,x,y,yто индекс 0 будет первой осью X, 1 — второй осью X и так далее. - < label_1_position >,...,< label_n_position >
- Положение метки вдоль оси. Это список числовых значений, разделенных запятыми, где каждое значение задает положение соответствующей метки в массиве
chxl: первая запись применяется к первой метке и так далее. Позиция — это значение в диапазоне для этой оси . Обратите внимание, что это всегда будет значение от 0 до 100, если вы не указали собственный диапазон с помощьюchxr. У вас должно быть столько позиций, сколько меток для этой оси.
Примеры
| Описание | Пример |
|---|---|
Этот пример включает метки оси R в указанных позициях на диаграмме. Текст метки задается с помощью параметра Метки с указанной позицией Метки с указанной позицией | |
В этом примере показано отображение значений меток по умолчанию, но только в указанных местах. | chxt=x,y chxt=x,ychxp не указан |


Стили меток осей chxs
Вы можете указать размер, цвет и выравнивание шрифта для меток осей, как для пользовательских меток, так и для значений меток по умолчанию. Все метки на одной оси имеют одинаковый формат. Если у вас есть несколько копий оси, вы можете отформатировать каждую из них по-разному. Вы также можете указать формат строки метки, например, чтобы отображать символы валюты или конечные нули.
По умолчанию верхняя и нижняя оси не показывают деления значений, а левая и правая оси их показывают.
Синтаксис
Значения для нескольких осей следует разделять с помощью вертикальной черты ( | ).
chxs=
 <axis_index><opt_format_string>,<opt_label_color>,<opt_font_size>,<opt_alignment>,<opt_axis_or_tick>,<opt_tick_color>,<opt_axis_color>
   |...|
 <axis_index><opt_format_string>,<opt_label_color>,<opt_font_size>,<opt_alignment>,<opt_axis_or_tick>,<opt_tick_color>,<opt_axis_color>
- < индекс_оси >
- Ось, к которой это относится. Это индекс, отсчитываемый от нуля, в параметре
chxt. - < строка_опт_формата >
- [ Необязательно ] Это необязательная строка формата, которая, если она используется, следует сразу после номера индекса оси без промежуточной запятой. Он начинается с буквы N, за которой следуют следующие значения (все необязательные):
N< preceding_text >*< number_type >< decimal_places >zs< x or y >*< following_text >
Вот значение каждого элемента:-
<preceding_text>— буквенный текст, предшествующий каждому значению. -
*...*— необязательный блок, заключенный в буквенные звездочки, в котором можно указать детали форматирования чисел. Следующие значения поддерживаются и являются необязательными:-
<number_type>— числовой формат для числовых значений. Выберите один из следующих вариантов:-
f- [ По умолчанию ] Формат с плавающей запятой. Рассмотрите также возможность указать точность с помощью значения < decimal_places >. -
p— процентный формат. Знак % добавляется автоматически. Примечание. При использовании этого формата значения данных от 0,0 до 1,0 преобразуются в значения от 0 до 100 % (например, 0,43 будет отображаться как 43 %). -
e- Формат научной записи. -
c< CUR >— форматирует число в указанной валюте с соответствующим маркером валюты. Замените< CUR >трехбуквенным кодом валюты. Пример:cEURдля евро. Список кодов можно найти на веб-сайте ISO , хотя поддерживаются не все символы.
-
-
<decimal_places>— целое число, определяющее количество отображаемых десятичных знаков. Значение округляется (не усекается) до этой длины. По умолчанию — 2. -
z— отображать конечные нули. По умолчанию нет . -
s— Отобразить разделители групп. По умолчанию нет . -
xилиy— отображение данных по координатам x или y, как указано. Значение данных x зависит от типа диаграммы: поэкспериментируйте с диаграммой, чтобы определить, что они означают. По умолчанию — «y» .
-
-
< following_text >— буквенный текст, следующий за каждым значением.
-
- <opt_label_color>
- Цвет, применяемый к тексту оси (но не к линии оси) в шестнадцатеричном формате RRGGBB . Цвет линии оси указывается отдельно с помощью opt_axis_color . По умолчанию серый.
- < opt_font_size >
- [ Необязательно ] указывает размер шрифта в пикселях. Этот параметр является необязательным.
- <opt_alignment>
- [ Необязательно ] Выравнивание меток. Для верхней или нижней оси это описывает, как метка выравнивается по отметке над или под ней; для левой или правой осей это описывает, как выравнивается внутри ограничивающей рамки, которая касается оси. Укажите одно из следующих чисел:
-
-1— Сверху или снизу : метки располагаются справа от галочек; Влево или вправо : метки в своей области выравниваются по левому краю. По умолчанию для меток оси R. -
0— сверху или снизу : метки центрируются по меткам; Слева или справа : метки центрируются в своей области. По умолчанию для меток осей X и T. -
1— Сверху или снизу : метки располагаются слева от галочек; Слева или справа : метки выравниваются по правому краю своей области. По умолчанию для меток оси Y.
-
- < opt_axis_or_tick >
- [ Необязательно; не поддерживается в Google-o-meter ] Показывать ли отметки и/или линии оси для этой оси. Засечки и оси доступны только для самых внутренних осей (например, они не поддерживаются для внешних из двух осей X). Используйте одно из следующих значений:
-
l(строчная буква «L») — рисовать только линию оси. -
t— рисовать только деления. Засечки — это маленькие линии рядом с метками осей. -
lt- [ По умолчанию ] Нарисуйте линию оси и отметки для всех меток. -
_- (подчеркивание) Не рисовать ни линию оси, ни деления. Если вы хотите скрыть линию оси, используйте это значение.
-
- < цвет_галочки >
- [ Необязательно ; не поддерживается в Google-o-meter ] Цвет отметки в шестнадцатеричном формате RRGGBB . По умолчанию серый.
- <opt_axis_color>
- [ Необязательно ] Цвет линии этой оси в шестнадцатеричном формате RRGGBB . По умолчанию серый.
Примеры
| Описание | Пример |
|---|---|
Размер и цвет шрифта указаны для второй оси X (январь, февраль, март). |
|
Размер, цвет и выравнивание шрифта указаны для правой оси Y. Отрисовываются деления, но не линия оси. |
|
Эта диаграмма включает три набора данных и показывает три набора меток осей, по одному на серию. Каждый набор меток форматируется с использованием пользовательской строки форматирования, как описано здесь:
The axis label ranges are set using the |  chd=s: |


Axis Tick Mark Styles chxtc
You can specify long tick marks for specific axes. Typically this is used to extend a tick mark across the length of a chart. Use the chxs parameter to change the tick mark color.
Values for multiple axes should be separated using a pipe character ( | ). Values within a series should be separated by a comma.
Syntax
chxtc=
  <axis_index_1>,<tick_length_1>,...,<tick_length_n>
    |...|
<axis_index_m>,<tick_length_1>,...,<tick_length_n>- < axis_index >
- The axis to which this applies. This is a zero-based index into the
chxtparameter. Separate values for different axes using a bar delimiter. - < tick_length_1 >,...,< tick_length_n >
- Length of the tick marks on that axis, in pixels. If a single value is given, it will apply to all values; if more than one value is given, the axis tick marks will cycle through the list of values for that axis. Positive values are drawn outside the chart area and cropped by the chart borders. The maximum positive value is 25. Negative values are drawn inside the chart area and cropped by the chart area borders.
Примеры
| Описание | Пример |
|---|---|
Example of using
|
|
This chart demonstrates alternating tick lengths. chxtc specifies two tick length values for the y-axis (5 and 15), and the ticks drawn on the chart alternate between the two values. |  chxt=x,y |

Background Fills chf [ All charts ]
You can specify fill colors and styles for the chart data area and/or the whole chart background. Fill types include solid fills, striped fills, and gradients. You can specify different fills for different areas (for example, the whole chart area, or just the data area). The chart area fill overwrites the background fill. All fills are specified using the chf parameter, and you can mix different fill types (solids, stripes, gradients) in the same chart by separating values with pipe character ( | ). Chart area fills overwrite chart background fills.
Solid Fills chf [ All Charts ]
You can specify a solid fill for the background and/or chart area, or assign a transparency value to the whole chart. You can specify multiple fills using the pipe character ( | ). (Maps: background only).
Syntax
chf=<fill_type>,s,<color>|...
- < fill_type >
- The part of the chart being filled. Specify one of the following values:
-
bg- Background fill -
c- Chart area fill. Not supported for map charts. -
a- Make the whole chart (including backgrounds) transparent. The first six digits of< color >are ignored, and only the last two (the transparency value) are applied to the whole chart and all fills. -
b <index>- Bar solid fills (bar charts only). Replace < index > with the series index of the bars to fill with a solid color. The effect is similar to specifyingchcoin a bar chart. See Bar Chart Series Colors for an example.
-
- с
- Indicates a solid or transparency fill.
- < color >
- The fill color, in RRGGBB hexadecimal format . For transparencies, the first six digits are ignored, but must be included anyway.
Примеры
| Описание | Пример |
|---|---|
This example fills the chart background with pale gray ( |
|
This example fills the chart background with pale gray ( |
|
| This example applies a 50% transparency to the whole chart (80 in hexadecimal is 128, or about 50% transparency). Notice the table cell background showing through the chart. |
|


Gradient Fills chf [ Line, Bar, Google-o-meter, Radar, Scatter,Venn ]
You can apply one or more gradient fills to chart areas or backgrounds. Gradient fills are fades from a one color to another color. (Pie, Google-o-meter charts: background only.)
Each gradient fill specifies an angle, and then two or more colors anchored to a specified location. The color varies as it moves from one anchor to another. You must have at least two colors with different < color_centerpoint > values, so that one can fade into the other. Each additional gradient is specified by a < color >,< color_centerpoint > pair.
Syntax
chf=<fill_type>,lg,<angle>,<color_1>,<color_centerpoint_1>
    ,...,
  <color_n>,<color_centerpoint_n>
- < fill_type >
- The chart area to fill. One of the following:
-
bg- Background fill -
c- Chart area fill. -
b <index>- Bar gradient fills (bar charts only). Replace < index > with the series index of the bars to fill with a gradient. See Bar Chart Series Colors for an example.
-
- lg
- Specifies a gradient fill.
- < angle >
- A number specifying the angle of the gradient from 0 (horizontal) to 90 (vertical).
- < color >
- The color of the fill, in RRGGBB hexadecimal format .
- < color_centerpoint >
- Specifies the anchor point for the color. The color will start to fade from this point as it approaches another anchor. The value range is from 0.0 (bottom or left edge) to 1.0 (top or right edge), tilted at the angle specified by < angle >.
Примеры
| Описание | Пример |
|---|---|
Chart area has a horizontal linear gradient, specified with an angle of zero degrees ( The colors are peach ( The chart background is drawn in gray ( |
|
Chart area has a diagonal (bottom left to top right) linear gradient, specified with an angle of forty-five degrees ( Peach ( Blue ( The chart background is drawn in gray ( |
|
Chart area has a vertical (top to bottom) linear gradient, specified with an angle of ninety degrees ( Blue ( Peach ( The chart background is drawn in gray ( |
|


Striped fills chf [ Line, Bar, Google-o-meter, Radar, Scatter, Venn ]
You can specify a striped background fill for your chart area, or the whole chart. (Pie, Google-o-meter charts: background only.)
Syntax
chf=
  <fill_type>,ls,<angle>,<color_1>,<width_1>
    ,...,
  <color_n>,<width_n>
- < fill_type >
- The chart area to fill. One of the following:
-
bg- Background fill -
c- Chart area fill -
b <index>- Bar striped fills (bar charts only). Replace < index > with the series index of the bars to fill with stripes. See Bar Chart Series Colors for an example.
-
- ls
- Specifies linear stripe fill.
- < angle >
- The angle of all stripes, relative to the y-axis. Use
0for vertical stripes or90for horizontal stripes. - < color >
- The color for this stripe, in RRGGBB hexadecimal format . Repeat < color > and < width > for each additional stripe. You must have at least two stripes. Stripes alternate until the chart is filled.
- < width >
- The width of this stripe, from
0to1, where1is the full width of the chart. Stripes are repeated until the chart is filled. Repeat < color > and < width > for each additional stripe. You must have at least two stripes. Stripes alternate until the chart is filled.
Примеры
| Описание | Пример |
|---|---|
|  chf= |
|  chf= |
Grid Lines chg [ Line, Bar, Radar, Scatter ]
You can specify solid or dotted grid lines on your chart using the chg parameter.
This parameter doesn't let you specify the thickness or color of the lines. For more ways to make lines across your chart, see shape markers ( chm type h, H, v, or V), range markers ( chm ), and axis tick marks ( chxtc ).
Syntax
chg=
  <x_axis_step_size>,<y_axis_step_size>,<opt_dash_length>,<opt_space_length>,<opt_x_offset>,<opt_y_offset>
- < x_axis_step_size >, < y_axis_step_size >
- Used to calculate how many x or y grid lines to show on the chart. 100 / step_size = how many grid lines on the chart. So: 20,25 would mean 5 vertical grid lines and 4 horizontal grid lines.
- < opt_dash_length >, < opt_space_length >
- [ Optional ] Used to define dashed grid lines. The first parameter is the length of each line dash, in pixels. The second parameter is the spacing between dashes, in pixels. Specify 0 for < opt_space_length> for a solid line. Default values are 4,1.
- < opt_x_offset >,< opt_y_offset >
- [ Optional ] The number of units, according to the chart scale, to offset the x and y grid lines, respectively. Can be positive or negative values. If you specify this value, you must also specify all preceding values. Default values are 0,0.
Примеры
| Описание | Пример |
|---|---|
These examples use only the |  chg=20,50 chg=20,50 |
This example uses larger spaces to display lighter grid lines ( |  |
To display solid grid lines, specify zero ( This chart also specifies an x-axis offset of 10. |  chg=20,50,1,0,10 |
This chart demonstrates an x-axis offset of 10, and ay axis offset of 20. |  chg=20,50,3,3,10,20 |
Line Styles chls [ Line, Radar ]
You can specify line thickness and solid/dashed style with the chls parameter. This parameter can only be used to style lines in line or radar charts; you cannot use it to style the line in a compound chart lines, unless the base type of the compound chart is a line chart.
Syntax
Separate multiple line styles by the pipe character ( | ); the first style applies to the first line, the second to the next, and so on. If you have fewer styles than lines, the default style is applied to all the unspecified lines.
chls=
  <line_1_thickness>,<opt_dash_length>,<opt_space_length>
    |...|
  <line_n_thickness>,<opt_dash_length>,<opt_space_length>
- < line_1_thickness >
- Thickness of the line, in pixels.
- < opt_dash_length >, < opt_space_length >
- [ Optional ] Used to define dashed grid lines. The first parameter is the length of each line dash, in pixels. The second parameter is the spacing between dashes, in pixels. For a solid line, specify neither value. If you only specify < opt_dash_length >, then < opt_space_length > will be set to < opt_dash_length >. Default is 1,0 (a solid line ).
Примеры
| Описание | Пример |
|---|---|
Here the dashed line is specified by |  chls=3,6,3|5 |
Dynamic Icon Markers chem [ Bar, Line, Radar, Scatter ]
Create your chart, and specify one or more dynamic icons as chem values. The syntax of chem is as follows. All semicolon-delimited items in purple are optional, and any one can be omitted entirely in your URL. You can include multiple markers by including multiple syntax strings delimited by a | характер. You can read more about dynamic icons on the dynamic icon page .
You can also embed a chart inside another chart as a dynamic icon. See the Embedded Charts subsection below.
chem=
  y;s=<icon_string_constant>;d=<marker_data_string>;ds=<which_series>;dp=<which_points>;py=<opt_z_order>;po=<x,y>;of=<x_offset,y_offset>
   |...|
  y;s=<icon_string_constant>;d=<marker_data_string>;ds=<which_series>;dp=<which_points>;py=<opt_z_order>;po=<x,y>;of=<x_offset,y_offset>
- s=< icon_string_constant >
- A string marker constant for a dynamic icon, from the dynamic icon page . This constant is almost the same as the
chstparameter for freestanding icons. But where the freestanding icon string starts with "d_", you should remove that prefix to get the equivalent dynamic icon marker. Example: freestanding icon:d_bubble_icon_text_small; equivalent dynamic icon marker:bubble_icon_text_small. - d=< marker_data_string >
- The data required for this particular marker type. This holds the same string that would be used in a
chldparameter for an equivalent freestanding icon, except that all | delimiters should be replaced by commas (remember to use commas instead of pipe markers for multiline text!). Note that within the data string, you must also escape the following characters with a @ mark: pipe ( | ) , at ( @ ) , equals ( = ), comma ( , ), semicolon ( ; ). Examples:hello@,+world,5@@10+cents+each. - ds=< which_series >
- [ Optional ] The zero-based index of the data series that this marker belongs to. Default value is 0.
- dp=< which_points >
- [ Optional ] Specifies which data points are used to draw markers. Default value is 0 (first point in the series) . Use one of the following formats:
-
nd- Which data point to draw the marker on, where nd is the zero-based index in the series. If you specify a non-integer value, then the fraction indicates a calculated intermediate point. For example, 3.5 means halfway between point 3 and point 4. -
range,< start >,< end >,< step >- Draw a marker on every step data point in a range from start to end , inclusive. start and end are index values, and can be floating point numbers to indicate intermediate values. All values are optional; defaults are: start=0, end=last item, step=1. If you skip a value, you must still include any intermediate commas, but you don't have to include empty trailing commas. Examples:dp=range,0,4draws a marker on elements 0 through 4;dp=range,5,10,2draws a marker on elements 5, 7, and 9;dp=range,2draws points on the third point and later;dp=range,3,,1.5draws markers on every 1.5 data points from the fourth item to the last. -
all- Draw a marker on every element. This is equivalent torange,0, end_index. Example:dp=all -
every,n- Draw a marker on every n th marker. Example:dp=every,2draws a marker on items 0, 2, and 4.
-
- py=< z_order >
- [ Optional ] The layer on which to draw the marker, compared to other markers and all other chart elements. This is a floating point number from -1.0 to 1.0, inclusive, where -1.0 is the bottom and 1.0 is the top. Chart elements (lines and bars) are just below zero. If two markers have the same value, they are drawn in the order given by the URL. Default value is 0.0 (just above the chart elements).
- po=< x,y >
- [ Optional ] An absolute position on the chart at which to draw the marker. x and y are two floating point numbers, where 0.0,0.0 is the bottom left corner and 1.0,1.0 is the top right corner.
- of=< x_offset,y_offset >
- [ Optional ] A number of pixels to offset the icon from its normal position. x_offset and y_offset are positive or negative integers. It is important to specify this value in an embedded dynamic icon, because the marker will be centered vertically and horizontally over the point, which means that the point probably won't line up with the data marker. A good offset for an upright pin is
of=0,22; a good offset for a slanted pin is eitherof=-12,20orof=12,20depending on the direction of the slant, but you might have to experiment. Default value is 0,0.
Примеры
| Описание | Пример |
|---|---|
| Here are examples of the same dynamic icon created as a free-standing image, and used as a marker in a line chart. Chart 1: Chart 2: |
|
Note that a dynamic icon marker will be centered on the point horizontally and vertically. So if you use a dynamic icon with a tail, the tail won't be on the chart point; the marker center will be. The first chart centers the mark on data point 3, which actually puts the tail a bit to the right of the mark on the line. The second chart uses the |  chem=y;chem=y; |
To include multiple dynamic icons, repeat the syntax string, delimited by a | характер. This example shows a range, as well as two individual markers. Note how the vertical pins are offset by of 0,22, and the slanted pin has an offset of 12,20 to make the pin points line up with the series that they describe. |  chem= |
This demonstrates a multiline text marker. The marker must be offset after adding the text, because the bubble resizes to fit the text, causing it to be re-centered on the chart. Note how newlines in the text are indicated by commas in the d data string. |  chem=y; |


Embedded Charts
You can embed one chart inside another using the dynamic icon syntax.
There are two styles of embedded chart markers: embedded charts in a bubble, and embedded charts with no bubble. Here are examples of both:
 |  |
Chart with bubble | Chart without bubble |
Here are the specifics of the s=< icon_string_constant >;d=< marker_data_string > parameters, both for non-bubble and bubble-embedded charts (parameters covered above aren't described again here):
Syntax
Non-bubble:
  chem=y;s=ec;d=<alignment_string>,<chart_data>;ds=<which_series>;dp=<which_points>;py=<z_order>;po=<x,y>;of=<x_offset,y_offset>

Bubble:
  chem=y;s=ecb;d=<frame_type>,<padding>,<frame_color>,<fill_color>,<chart_data>;ds=<which_series>;dp=<which_points>;py=<z_order>;po=<x,y>;of=<x_offset,y_offset>
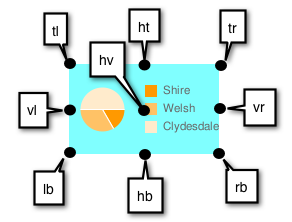
- alignment_string
- [ Non-bubble only ] Which part of the bubble-less embedded chart is pinned to the data point. Choose one of the two-letter string constants in the following diagram:
- chart_data
- The data for the embedded chart. This is everything after
https://chart.googleapis.com/chart?in the URL of the chart to embed. Use the tool below, or follow the rules listed below the tool. - frame_type
- [ Bubble only ] One of the dynamic icon frame style constants .
- padding
- [ Bubble only ] Padding inside the bubble, in pixels.
- frame_color
- [ Bubble only ] Color of the frame, as a six-digit HTML color string without the # mark. Example:
FF00FF. - fill_color
- [ Bubble only ] Bubble fill color, as a six-digit HTML color string without the # mark. Example:
FF00FF.
Embedded chart data
Use the following conversion tool to help generate your chart string, or else generate the chart string manually following the rules given after the tool.
Rules for manual conversion
1. First replace all the following characters in the parameter and value pairs with the following values, in the order shown:
| Replace | With this |
|---|---|
%7C or %7c | | |
@ | @@ |
% | %25 |
, | @, |
| | @| |
; | @; |
& | %26 |
"=" | %3D |
2. Then replace all the & and = values in the parameter1=value1¶meter2=value2... pairs with commas.
Line Fills chm [ Line, Radar ]
You can fill the area below a data line with a solid color.
You can combine line fills with any other chm parameters using a pipe character ( | ) to separate the chm parameters.
Syntax
chm=
  <b_or_B>,<color>,<start_line_index>,<end_line_index>,<0>
    |...|
<b_or_B>,<color>,<start_line_index>,<end_line_index>,<0>- < b_or_B >
- Whether to fill to the bottom of the chart, or just to the next lower line.
- B - Fill from
< start_line_index >to the bottom of the chart.< end_line_index >supports a special syntax to let you fill a segment of the chart. This is easiest if you have a chart with a single line that you want to fill. - b - Fill between two lines in a multi-line chart. Start and end lines are indicated by
< start_line_index >and< end_line_index >.
- B - Fill from
- < color >
- An RRGGBB format hexadecimal number of the fill color.
- < start_line_index >
- The index of the line at which the fill starts. The first data series specified in
chdhas an index of zero (0), the second data series has an index of1, and so on. - < end_line_index >
- Fill type 'b' - The line at which to stop the fill. This line must be below the current line.
- Fill type 'B' - One of the following choices:
- any value - Any single number in this parameter is ignored, and the fill will go from the specified line to the base of the chart
- start:end - To fill a vertical slice below the chart, specify start:end , where these are data point indices describing where to start and stop the fill. Both values are optional, and default to first_point : last_point . (See example below.)
- <0>
- Reserved — must be zero.
Примеры
| Описание | Пример |
|---|---|
For a single series, it is simplest to use This is the only fill area type available for radar charts. |
|
Here's a chart with two lines and two fills. Filling the area below the bottom line and above the top line requires a special technique, covered next. |
|
In a multi-line chart, to fill from the top of the chart to the first line, include a series that contains two copies of the highest data value for the data format. So, for example, " To fill from the last line to the bottom of the chart, include a series that contains two copies of the lowest data value for the data format. So, for example, AAAA for extended encoding, 0,0 for basic text format, and so on. The lines themselves are drawn in black, using |  chd=e: (highest value) chm= (light blue)b,224499,1,2,0| (blue)b,FF0000,2,3,0| (red)b,80C65A,3,4,0 (green)chco=000000 |
Here is a line chart with vertical fill slices. This is accomplished by specifying a start : end pair for < end_line_index > with line fill type 'B'.
|  chm= |
This example shows using a line fill on a radar chart. |  chm= |


Shape Markers chm [ Bar, Line, Radar, Scatter ]
You can specify graphical markers for all or individual data points on a chart. If two or more markers occupy the same point, the markers are drawn in the order in which they appear in the chm parameter. You can also create text markers on data points, which is covered in Data Point Markers .
You can combine shape markers with any other chm parameters using a pipe character ( | ) to separate the chm parameters.
Syntax
Specify one set of the following parameters for each series that should be marked. To mark multiple series, create additional parameter sets, delimited by a pipe character. You do not need to mark up all series. If you do not assign markers to a data series, it will not get any markers.
Shape markers behave slightly differently in scatter charts . See that documentation for more information.
chm=
  [@]<marker_type>,<color>,<series_index>,<opt_which_points>,<size>,<opt_z_order>,<opt_offset>
    |...|
  [@]<marker_type>,<color>,<series_index>,<opt_which_points>,<size>,<opt_z_order>,<opt_offset>
- @
- [ Optional ] If you precede the marker type with the optional @ character, then < opt_which_points > should use the x:y format.
- <marker_type>
- The type of marker to use. Specify one of the following types:
-
a- Arrow -
c- Cross -
C- Rectangle. If a rectangle marker, you must have at least two data series, where series 0 specifies the bottom edge and series 1 specifies the top edge. < size > specifies the width of the rectangle, in pixels. -
d- Diamond -
E- Error-bar marker ( ) This marker requires two data series to create, one value for the bottom, and the corresponding point in the second series for the top. It also exposes an extended < size > syntax: line_thickness [: top_and_bottom_width ] where top_and_bottom_width is optional. См. примеры ниже.
 -
h- Horizontal line across the chart at a specified height. ( The only valid format for < opt_which_points > parameter is nd . ) -
H- Horizontal line through the specified data marker. This supports an extended < size > syntax that lets you specify an exact line length: line_thickness [: length ] where : length is optional, and defaults to the full chart area width. -
o- Circle -
s- Square -
v- Vertical line from the x-axis to the data point -
V- Vertical line of adjustable length. This supports an extended < size > value syntax that lets you specify an exact line length: line_thickness [: length ] where : length is optional, and defaults to the full chart area height. The marker is centered on the data point. -
x- An X
-
- < color >
- The color of the markers for this series, in RRGGBB hexadecimal format .
- < series_index >
- The zero-based index of the data series on which to draw the markers. Ignored for
hmarkers and markers that specify location by x/y position (start with the @ character). You can use hidden data series as a source for markers; see Compound Charts for more information. Grouped vertical bar charts support a special extended syntax to align markers with specific bars. - < opt_which_points >
- [ Optional ] Which point(s) to draw markers on. Default is all markers. Use one of the following values:
-
nd- Where to draw the marker. The meaning depends on the marker type:- All types except h - Which data point to draw the marker on, where nd is the zero-based index in the series. If you specify a non-integer value, then the fraction indicates a calculated intermediate point. For example, 3.5 means halfway between point 3 and point 4.
-
h- A number from 0.0 to 1.0, where 0.0 is the bottom of the chart, and 1.0 is the top of the chart.
-
-1- Draw a marker on all data points. You can also leave this parameter empty to draw on all data points. -
- n- Draw a marker on every n -th data point. Floating point value; if n is less than 1 the chart will calculate additional intermediary points for you. For example, -0.5 will put twice as many markers as data points. -
start:end:n- Draw a marker on every n -th data point in a range, from start to end index values, inclusive. All parameters are optional (may be absent), so 3::1 would be from the fourth element to the last, step 1, and omitting this parameter entirely would default to first : last :1. All values can be floating point numbers. start and end can be negative, to count backward from the last value. If both start and end are negative, be sure that they are listed in increasing value (for example, -6:-1:1). If the n step value is less than 1, it will calculate additional data points by interpolating the data values given. Default values are first:last:1 -
x : y- Draw a marker at a specific x/y point on the chart. This point does not have to be on a line. Add the @ character before the marker type to use this option. Specify the coordinates as floating point values, where0:0is the bottom left corner of the chart and1:1is the top right corner of the chart. For example, to add a red, 15-pixel diamond to the center of a chart, use@d,FF0000,0,0.5:0.5,15.
-
- < size >
- The size of the marker, in pixels. Most take a single number value for this parameter; the V, H, and S markers support the syntax < size >[: width ] where the optional second part specifies the line or marker length.
- < opt_z_order >
- [ Optional ] The layer on which to draw the marker, compared to other markers and all other chart elements. This is a floating point number from -1.0 to 1.0, inclusive, where -1.0 is the bottom and 1.0 is the top. Chart elements (lines and bars) are just lower than zero. If two markers have the same value, they are drawn in the order given by the URL. Default value is 0.0 (just above the chart elements).
- < opt_offset >
- [ Optional ] Let you specify horizontal and vertical offsets from the specified location. Here is the syntax, which uses a : delimiter:
reserved :< horizontal_offset >:< vertical_offset >. If specified, you can include an empty ,, value in thechmparameter string for < opt_z_order >. Examples:o,FF9900,0,4,12,, :10 o,FF9900,0,4,12.0,, :-10:20 o,FF9900,0,4,12,1, ::20- reserved - Leave blank.
-
< horizontal_offset >- A positive or negative number specifying the horizontal offset, in pixels. Optional; leave blank if not used. -
< vertical_offset >- A positive or negative number specifying the vertical offset, in pixels. Optional; leave blank if not used.
Примеры
| Описание | Пример |
|---|---|
Here's an example of several of the shape and line markers.
|  chm= |
Here's an example using diamonds for one data series, and circles for the other data series. If two or more markers occupy the same point, the markers are drawn in the order in which they appear in the |  chm= |
Here's a line chart with a marker on every second data point (-2 means every other point). |  chd=t: |
| Here's a line chart with twice as many markers as data points (-0.5 means every half point). |  chd=t: |
This example shows how to use h and v markers to create grid lines with custom colors and thickness. The z-order value (the last value) is set to -1 so that the grid lines are drawn beneath the data line. |  chm= |
This chart adds vertical fill lines to a line chart:
|  chm= |
| This example adds an arrow and text marker to the chart using exact coordinates. The first D marker is the trace line under the bars. The second marker is the arrow, and the third marker is the arrow text. |  chm= |
A horizontal line fixed to a specific data point ( H ) can be useful for showing relative values, or emphasizing the height of a data value on a chart. |  chm=H,FF0000,0,18,1 |
This graph demonstrates the markers that can specify line thickness and length in the < size > parameter.
| title="cht=lc&chd=s:2gounjqLaCf,jqLaCf2goun&chco=008000,00008033&chls=2.0,4.0,1.0&chs=250x150&chm=H,990066,1,2,5:50%7CV,3399CC,0,8,3:50%7CE,000000,0,6,1:20" src="/chart/image/images/chart_95.png" />chm= |
Text and Data Value Markers chm [ Bar, Line, Radar, Scatter ]
You can label specific points on your chart with custom text, or with formatted versions of the data at that point.
You can combine any chm markers using a pipe character ( | ) to separate the chm parameter sets.
A note on string values: Only URL-safe characters are permitted in label strings. To be safe, you should URL-encode any strings containing characters not in the character set 0-9a-zA-Z . You can find a URL encoder in the Google Visualization Documentation .
Syntax
Specify one set of the following parameters for each series that should be marked. To mark multiple series, create additional parameter sets, delimited by a pipe character. You do not need to mark up all series. If you do not assign markers to a data series, it will not get any markers.
chm=
  <marker_type>,<color>,<series_index>,<opt_which_points>,<size>,<opt_z_order>,<opt_placement>
    |...|
  <marker_type>,<color>,<series_index>,<opt_which_points>,<size>,<opt_z_order>,<opt_placement>
- <marker_type>
- The type of marker to use. You can choose from the following types:
-
f<text>- A flag containing text. Specify the character 'f', followed by custom URL-encoded text. To escape commas in text markers, precede the comma by a \ mark. Example:fHello\,+World! -
t<text>- A simple text marker. Specify the character 't' followed by custom URL-encoded text. To escape commas in text markers, precede the comma by a \ mark. Example:tHello\,+World! -
A< text >- An annotation marker. This is similar to a flag marker, but markers will coordinate their position so that they do not overlap. The only valid format for < opt_which_points > is nd , to signify the index of a point in the series. -
N< formatting_string >- The value of the data at this point, with optional formatting. If you do not use thechdsparameter (custom scaling) it gives the exact encoded value; if you do use that parameter with any format type the value will be scaled to the range that you specify. See an example ofchdswith numeric markers below. With this marker type in a stacked bar chart , if you specify -1 for < series_index > you will get a marker that shows the sum of all values in this stacked bar. The formatting string syntax is as follows:
< preceding_text >*< number_type >< decimal_places >zs< x or y >*< following_text >.
All of these elements are optional. Here is the meaning of each element:-
<preceding_text>- Text to precede each value. -
*...*- An optional block wrapped in literal asterisks, in which you can specify formatting details for numbers. The following values are supported, and are all optional:-
<number_type>- The number format, for numeric values. Choose one of the following:-
f- [ Default ] Floating point format. Consider specifying precision as well with the < decimal_places > value. -
p- Percentage format. A % sign is appended automatically. Note: When using this format, data values from 0.0 — 1.0 map to 0 — 100% (for example, 0.43 will be shown as 43%). -
e- Scientific notation format. -
c< CUR >- Format the number in the currency specified, with the appropriate currency marker. Replace< CUR >with a three-letter currency code. Example:cEURfor Euros. You can find a list of codes on the ISO web site , although not all symbols are supported.
-
-
<decimal_places>- An integer specifying how many decimal places to show. The value is rounded (not truncated) to this length. Default is 2. -
z- Display trailing zeros. Default is no . -
s- Display group separators. Default is no . -
xory-Display the data from the x- or y-coordinate, as specified. The meaning of x data varies by chart type: experiment with your chart to determine what it means. Default is 'y' .
-
-
< following_text >- Text to follow each value.
-
-
- < color >
- The color of the markers for this set, in RRGGBB hexadecimal format .
- < series_index >
- The zero-based index of the data series on which to draw the markers. If this is a stacked bar chart and the marker type is N (data point values), you can specify -1 to create a summed value marker for each stack of bars. See below for an example.
- < opt_which_points >
- [ Optional ] Which point(s) to draw markers on. Default is all markers. Use one of the following values:
-
nd- Which data point to draw the marker on, where nd is the zero-based index in the series. If you specify a non-integer value, then the fraction indicates a calculated intermediate point. For example, 3.5 means halfway between point 3 and point 4. -
-1- Draw a marker on all data points. You can also leave this parameter empty to draw on all data points. -
-n- Draw a marker on every n -th data point. -
start : end : n- Draw a marker on every n -th data point in a range, from start to end index values, inclusive. All parameters are optional (may be absent), so 3::1 would be from the fourth element to the last, step 1, and omitting this parameter entirely would default to first : last :1. All values can be floating point numbers. start and end can be negative, to count backward from the last value. If both start and end are negative, be sure that they are listed in increasing value (for example, -6:-1:1). If the n step value is less than 1, it will calculate additional data points by interpolating the data values given. Default values are first:last:1 -
x : y- [ Not supported for N-type markers ] Draw a marker at a specific x/y point on the chart. This point does not have to be on a line. Add the at character (@) before the marker type to use this option. Specify the coordinates as floating point values, where0:0is the bottom left corner of the chart,0.5:0.5is the center of the chart, and1:1is the top right corner of the chart. For example, to add a red, 15-pixel diamond to the center of a chart, use@d,FF0000,0,0.5:0.5,15.
-
- < size >
- The size of the marker in pixels. If this is a scatter chart with a third data series (used to specify point sizes), this value will be scaled by the data range. So if the data range is 0—100 and < size > is 30, a data value of 100 would be 30 pixels wide, a data value of 50 would be 15 pixels wide, and so on.
- < opt_z_order >
- [ Optional ] The layer on which to draw the marker, compared to other markers and all other chart elements. This is a floating point number from -1.0 to 1.0, inclusive, where -1.0 is the bottom and 1.0 is the top. Chart elements (lines and bars) are just lower than zero. If two markers have the same value, they are drawn in the order given by the URL. Default value is 0.0 (just above the chart elements).
- < opt_placement >
- [ Optional ] Additional placement details describing where to put this marker, in relation to the data point. You can specify horizontal and/or vertical relative positioning, as well as offsets. Placement syntax is a string with : delimiters as shown here. All elements are optional:
< horizontal_and_vertical_justification >:< horizontal_offset >:< vertical_offset >. If specified, you can include an empty ,, value in thechmparameter string for < opt_z_order >. Examples:N,000000,0,1,10,,bandN,000000,0,1,10,,lvandN,000000,0,1,10,,r::10.- horizontal_and_vertical_justification
- The anchor point of the marker. This behaves opposite to justification, so a left anchor actually puts the marker to the right of the data point. You can choose a horizontal and/or vertical justifier from the following list:
- Horizontal placement : 'l', 'h', or 'r' - Left, center, or right-anchored, horizontally. Default is 'l'.
- Vertical placement : 'b', 'v', 't' - Bottom, middle, or top-anchored, vertically. Default is 'b'.
- Bar-relative placement [ Bar charts only] : 's', 'c', 'e' - Base, center, or top of a bar. For stacked charts, this is relative to the section of the bar for each series, not for the whole bar. If the series index given is -1 (stack total) it is in relation to the whole bar. This can be combined with vertical placement values: for example, 'be' or 'vs'. Default value is 'e'.
- horizontal_offset
- A horizontal offset for this marker, in pixels. Default is 0.
- vertical_offset
- A vertical offset for this marker, in pixels. Non-bar chart default: 15; bar chart chart default: 2 .
| Описание | Пример | |
|---|---|---|
Here's an example of value labels on a bar chart. The first chart ( The second chart ( |
| |
You can use the This example shows a chart with simple-encoded values of 46, 39, 29, 30, 43, 41. Simple encoding range is 0—61 . The |  chd=s:underp | |
Here's an example of a chart with a text label at the minimum point and a flag label at the maximum point. |
| |
| This example shows a stacked chart with values for individual series, plus the series total. To show the stacked series values, we must use the 'c' positioning option; if we did not, the top bar value would overlap the sum value at the top of each bar. |  chm= | |
| Some more demonstrations of how vertical and horizontal placement work. This example demonstrates various combinations of anchor values for bar charts (which use s, c,and e for vertical placement). Note how a right anchor moves a marker left, and a top anchor moves a marker down, and vice-versa. The red dots show the base, center, and top of each bar. The number is the data value, fixed using different anchor values for each bar. |  chm= | |
Annotation markers automatically adjust the label position so that they don't overlap. The first chm value is for the line fill, the following values are all annotation markers. |  chm=B,C5D4B5BB,0,0,0 | |
| Another annotation marker example demonstrating city altitudes in Switzerland. |  | |


Range Markers chm [ Bar, Candlestick, Line, Radar, Scatter ]
You can color horizontal or vertical bands of background fill to highlight specific areas of a chart.
You can combine any chm markers using a pipe character ( | ) to separate the chm parameter sets.
Syntax
Specify one set of the following parameters for each band to draw. To draw multiple bands, create additional parameter sets, delimited by a pipe character. Ranges are drawn in the order specified, so the last range drawn will be drawn on top of previous ranges.
chm=
  <direction>,<color>,0,<start_point>,<end_point>
    |...|
  <direction>,<color>,0,<start_point>,<end_point>
- <direction>
- Specifies horizontal or vertical shading. Use
rfor a horizontal range andRfor a vertical range. - < color >
- The range color as an RRGGBB format hexadecimal number .
- 0
- Reserved — must be zero.
- < start_point >
- The start position of the range.
- For horizontal range markers, this is a position on the y-axis, where
0.00is the bottom of the chart, and1.00is the top of the chart. - For vertical range markers, this is a position on the x-axis, where
0.00is the left of the chart, and1.00is the right of the chart.
- < end_point >
- The end position of the range.
- For horizontal range markers, this is a position on the y-axis, where
0.00is the bottom of the chart, and1.00is the top of the chart. - For vertical range markers, this is a position on the x-axis, where
0.00is the left of the chart, and1.00is the right of the chart.
Примеры
| Описание | Пример |
|---|---|
Range markers can be a thin line or a band of color.
|  |
This example shows the vertical range markers. The first marker is a red line ( |  |
Markers are drawn in the order specified. In this example, you can see that the vertical red marker was drawn before the pale blue horizontal marker. |  chm= |
Here's an example of a line chart that uses range markers to draw faint horizontal lines across the chart at the zero line, midpoint line, and top. |  |
Line Markers chm=D [ Bar, Candlestick, Line, Radar, Scatter ]
You can add a line that traces data in your chart. Most often, this is used in compound charts .
To add multiple lines (or combine this with any other chm markers), separate the chm parameter sets using a pipe ( | ) delimiter. You cannot make a dashed line marker with this parameter.
Syntax
chm=
  D,<color>,<series_index>,<which_points>,<width>,<opt_z_order>
- Д
- Indicates that this is a line marker.
- < color >
- The color of the line, in RRGGBB hexadecimal format .
- < series_index >
- The index of the data series used to draw the line. The data series index is
0for the first data series,1for the second data series, and so on. - < which_points >
- Which points in a series to use to draw the line. Use one of the following values:
-
0- Use all the points in the series. -
start:end- Use a specific range of points in the series, from the start to end , inclusive (zero-based index). You can also use floating point values to specify intermediate points, or leave start or end blank to indicate the first or last data point, respectively. start and end can be negative, as a reverse index from the last value. If both start and end are negative, be sure to write them in increasing value (for example, -6:-1).
-
- < size >
- The width of the line in pixels.
- < opt_z_order >
- [ Optional ] The layer on which to draw the marker, compared to other markers and all other chart elements. This is a floating point number from -1.0 to 1.0, inclusive, where -1.0 is the bottom and 1.0 is the top. Chart elements (lines and bars) are just lower than zero. If two markers have the same value, they are drawn in the order given by the URL. Default value is 0.0 (just above the chart elements).
Примеры
| Описание | Пример |
|---|---|
This is an example of drawing a marker line on a bar chart. The z-order is set to |  chm=D,0033FF,0,0,5,1 |
This is the same bar chart, but with an additional data series just for the line. This is an example of a compound chart. Compound charts are drawn by adding additional data series to the See Compound Charts for more information. |  chm=D,0033FF,1,0,5,1 |
Data Functions chfd [ All chd charts ]
You can specify a custom function to run over chart data using muParser function syntax . The data used in the function can come from one of two sources:
- A data series from
chd- The data is pulled from the specified series inchd. - A range of values declared in the
chfdparameter itself - You declare a start, stop, and step value for an arbitrary data range.
It is important to note that in all cases you must assign the output to an existing series in chd ; that series will be overwritten by the function output. The chart is rendered only after all functions have been processes, so if you assign multiple functions to output to the same data series, the functions will be run in the order given, but only the output of the final function will be plotted on the chart. Note that you can chain functions, so that one function can take as input a series that was output by a previous function.
To assign colors or chm markers to a function line, assign the colors or markers to the function's series index. Note that markers are placed according to the data after it has been manipulated by the function.
Syntax
chfd=
  <output_series_index>,<function_data>,<function_string>
    |...|
<output_series_index>,<function_data>,<function_string>- < output_series_index >
- Zero-based index of a data series in
chdto which the function output will be written. Any existing data will be completely overwritten by the function output. If a series is not being used as input for a function, best practice is to assign a single dummy value to that series. - < function_data >
- The variables and data to plot. The data can be from a range that you define, or from one of the
chddata series. You can specify multiple variables for each function, using a ; (semicolon) delimiter for multiple variables. Note that if you define multiple variables for a single function, and these variables have a different number of points, the function will stop when it reaches the first endpoint. For example, if a function defines both x=1—5 step 1 and y=1—10 step 1, the function will end when it reaches the fifth point.
< variable_name >,< input_series_index >OR
< variable_name >,< start >,< end >,< step >- variable_name - An arbitrary string name for the variable. Use this in the function defined by function_string .
- input_series_index - The index of a
chddata series to use as input data. - start - The numeric start value of a range.
- end - The numeric end value of a range.
- step - The numeric step value from start to end . Can be positive or negative, but cannot be zero.
x,0,100,1declares a variable namedxwith values 0, 1, 2, ... 100.x,0,100,1;r,0,3.1,.1declares the samexvariable plus a variable namedrwith values 0, 0.1, 0.2, ..., 3.0, 3.1.x,0declares a variable named x that uses the data from the firstchdseries. These variables will be used by function_string . They will not be plotted on the graph unless you specify them in function_string . The smaller the step, the smoother your graph. - < function_string >
- Your function, written in the muParser syntax . The function is applied to the variables and data specified in variable_data . You can only reference the variables declared in this local function set, not in another piped set of
chfdparameters. Summary muParser functions are not supported (min, max sum, avg). IMPORTANT: Remember to use%2Binstead of+in your functions!
Примеры
| Описание | Пример |
|---|---|
A simple sine wave. Some things to notice:
| *50%2b50&chxt=x,y") cht=lc |
This line uses data from the chd parameter. |  chd=t:5,10 |
A mix of function and non-function lines. Notice how the colors are specified by the series color parameter Notice the placement of markers on the function output; the data points are calculated from start , end , and step , so if your range is 0—11 step 0.1, point 0 is 0, point 1 is 0.1 and so on, until point 110, which has a value of 11. | *50%2B50&chxt=x,y&chm=c,00A5C6,0,110,10|a,00A5C6,0,60,10") chd=t: |
To define a function in two dimensions, use an
| *50%2B50|1,y,0,10,0.1,cos(y)*50%2B50") cht=lxy |
The Try clicking these images to open and play with them in the chart playground; you'll get hooked! | |


*(exp(cos(t))-2.0*cos(4.0*t)-sin(t/12.0)^5)*20|1,t,0,100,.05,cos(t)*(exp(cos(t))-2.0*cos(4.0*t)-sin(t/12.0)^5.0)*20-10&chf=c,lg,90,FFE7C6,0,76A4FB,1|bg,s,EFEFEF&chxt=x,y&chxs=0,000000,0,0,_|1,000000,0,0,_")
*50%2b50|1,y,0,360,.1,cos(y)*50%2b50&chco=FFFF10&chf=bg,lg,90,000000,0,FFFFFF,.5,000000,1")
*40%2b50|1,y,0,180,1.4,cos(3*y)*40%2b50")
*40%2b50|1,y,0,360,1.9,cos(6*y)*40%2b50&chf=c,lg,90,FFFF00,0,FF9933,1&chco=006699")