- Dataset Availability
- 2014-03-01T00:00:00Z–2024-04-16T14:00:00Z
- Dataset Provider
- JAXA Earth Observation Research Center
- Earth Engine Snippet
-
ee.ImageCollection("JAXA/GPM_L3/GSMaP/v6/operational") - Tags
Description
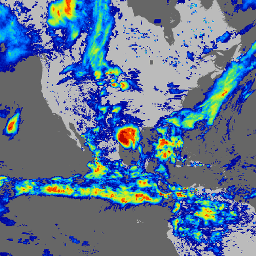
Global Satellite Mapping of Precipitation (GSMaP) provides a global hourly rain rate with a 0.1 x 0.1 degree resolution. GSMaP is a product of the Global Precipitation Measurement (GPM) mission, which provides global precipitation observations at three hour intervals. Values are estimated using multi-band passive microwave and infrared radiometers from the GPM Core Observatory satellite and with the assistance of a constellation of other satellites. GPM's precipitation rate retrieval algorithm is based on a radiative transfer model. The gauge-adjusted rate is calculated based on the optimization of the 24h accumulation of GSMaP hourly rain rate to daily precipitation by NOAA/CPC gauge measurement. This dataset is processed by GSMaP algorithm version 6 (product version 3). See GSMaP Technical Documentation for more details.
This dataset contains provisional products GSMaP_NRT that are regularly replaced with updated versions when the GSMaP_MVK data become available. The products are marked with a metadata property called ''status''. When a product is initially made available, the property value is ''provisional''. Once a provisional product has been updated with the final version, this value is updated to ''permanent''. For more information please refer General Documentation
Bands
Resolution
11132 meters
Bands
| Name | Units | Min | Max | Description | |||||||||||||||||||||||||||||||||||||||||||||||||||||||||||||||||||||||||||||||||||||||||||||||
|---|---|---|---|---|---|---|---|---|---|---|---|---|---|---|---|---|---|---|---|---|---|---|---|---|---|---|---|---|---|---|---|---|---|---|---|---|---|---|---|---|---|---|---|---|---|---|---|---|---|---|---|---|---|---|---|---|---|---|---|---|---|---|---|---|---|---|---|---|---|---|---|---|---|---|---|---|---|---|---|---|---|---|---|---|---|---|---|---|---|---|---|---|---|---|---|---|---|---|---|
hourlyPrecipRate |
mm/hr | 0* | 204.88* | Snapshot of hourly precipitation rate |
|||||||||||||||||||||||||||||||||||||||||||||||||||||||||||||||||||||||||||||||||||||||||||||||
hourlyPrecipRateGC |
mm/hr | 0* | 200.36* | Snapshot of hourly precipitation rate adjusted to rain gauge |
|||||||||||||||||||||||||||||||||||||||||||||||||||||||||||||||||||||||||||||||||||||||||||||||
observationTimeFlag |
h | -124.72* | 16.06* | Relative time from the starting time of the file to the time of microwave radiometer (imager/sounder) observing. If no observation exists within the hourly window, the time will be the negative number of hours since the last observation. |
|||||||||||||||||||||||||||||||||||||||||||||||||||||||||||||||||||||||||||||||||||||||||||||||
satelliteInfoFlag |
Satellite/sensor used |
||||||||||||||||||||||||||||||||||||||||||||||||||||||||||||||||||||||||||||||||||||||||||||||||||
gaugeQualityInfo |
count/d | 0* | 121* | Existence of gauge adjustment when the status is 'provisional', 1 indicates adjusted and 0 is non-adjusted. When the status is 'permanent', the pixel value is the daily average of number of gauges used for adjustment in the pixel. |
|||||||||||||||||||||||||||||||||||||||||||||||||||||||||||||||||||||||||||||||||||||||||||||||
Image Properties
Image Properties
| Name | Type | Description |
|---|---|---|
| AlgorithmID | STRING | The algorithm that generated this product, e.g., 3GSMAPH |
| AlgorithmVersion | STRING | The version of the algorithm that generated this product |
| ProductVersion | STRING | The data version assigned by the processing system |
| GenerationDateTime | STRING | The date and time this granule was generated |
| StartGranuleDateTime | STRING | The start time defining this granule |
| StopGranuleDateTime | STRING | The stop time defining this granule |
| status | STRING | Permanent or provisional |
Terms of Use
Terms of Use
Anyone wishing to publish any results using the data from the JAXA Global Rainfall Watch System should clearly acknowledge the ownership of the data in the publication (for example, ' Global Rainfall Map in Near-Real-Time (GSMaP_NRT) by JAXA Global Rainfall Watch' was produced and distributed by the Earth Observation Research Center, Japan Aerospace Exploration Agency). If you have benefited from GSMaP rainfall products, please cite the major papers listed below. For additional information, please visit the JAXA Site Policy and the Users Guide.
Citations
Kubota, T., K. Aonashi, T. Ushio, S. Shige, Y. N. Takayabu, M. Kachi, Y. Arai, T. Tashima, T. Masaki, N. Kawamoto, T. Mega, M. K. Yamamoto, A. Hamada, M. Yamaji, G. Liu and R. Oki 2020: Global Satellite Mapping of Precipitation (GSMaP) products in the GPM era, Satellite precipitation measurement, Springer, https://doi.org/10.1007/978-3-030-24568-9_20.
DOIs
Explore with Earth Engine
Code Editor (JavaScript)
var dataset = ee.ImageCollection('JAXA/GPM_L3/GSMaP/v6/operational')
                  .filter(ee.Filter.date('2018-08-06', '2018-08-07'));
var precipitation = dataset.select('hourlyPrecipRate');
var precipitationVis = {
  min: 0.0,
  max: 30.0,
  palette:
      ['1621a2', 'ffffff', '03ffff', '13ff03', 'efff00', 'ffb103', 'ff2300'],
};
Map.setCenter(-90.7, 26.12, 2);
Map.addLayer(precipitation, precipitationVis, 'Precipitation');