
You can use your community visualization as a chart filter, filtering the report through interactions with your community visualization.
How community visualization chart filters work
In order to use your community visualization as a chart filter, you need to:
- Configure the
config.interactionsproperty - Write code that calls
dscc.sendInteraction()with the filter information.
Defining interactions
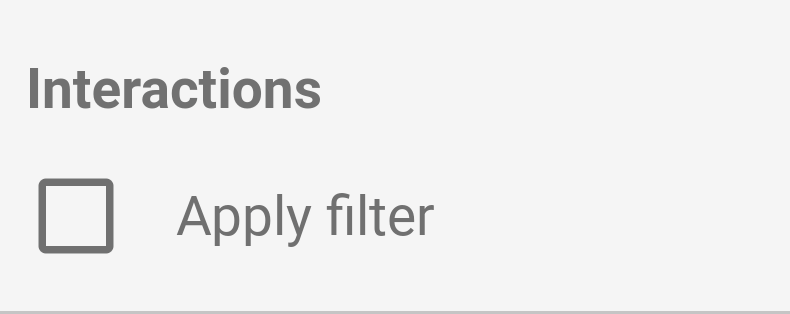
If your visualization supports interactions, they should be defined in your config. When defined, a checkbox shows up in the property panel.
Example config.interactions:
{
  "data": ...,
  "style": ...,
  "interactions": [
    {
      "id": "interactionsConfigId",
      "supportedActions": ["FILTER"]
    }
  ]
}
Writing code for a filter
Use dscc.sendInteraction() to associate user interaction with a filter action.
Example:
const handleInteraction = () => {
  // this is the interactionId defined in the config
  const interactionId = "interactionConfigId";

  // the ID of the field you want to filter on
  const dimensionId = "qt_ky8sltutsb";

  // the value of the field you want to filter on
  const value = "USA";

  // the interaction type - only FILTER is supported right now
  const FILTER = dscc.InteractionType.FILTER;

  let interactionData = {
    concepts: [dimensionId],
    values: [[value]]
  };

  // send Looker Studio an instruction to filter other charts in the dashboard
  dscc.sendInteraction(interactionId, FILTER, interactionData);
};
Looker Studio will ignore messages sent by dscc.sendInteraction if the report
editor has not enabled "filter" interactions for your visualization.
Keeping track of filter state
The data object Looker Studio sends to your visualization provides information
about interactions.
Example data.interactions:
"onClick": {
  "value": {
    "type": "FILTER",
      "data": {
      "concepts": [
        "qt_h6oibrb6wb",
        "qt_i6oibrb6wb"
      ],
        "values": [
          [
            "Afternoon",
            "Sunday"
          ],
          [
            "Afternoon",
            "Thursday"
          ],
          [
            "Morning",
            "Tuesday"
          ]
        ]
    }
  },
  "supportedActions": [
    "FILTER"
  ]
}
If value.data is not undefined, the visualization is currently filtering other
components of the dashboard.
Example:
const barHighlighting = (interactionsById) => {
  // the interactionId defined in the config
  const interactionId = "interactionConfigId";

  const interactionField = interactionsById[interactionId];

  // if filter is selected
  const filterSelected = interactionField.type === "FILTER";
  // if the viz is currently acting as a filter
  const filterHasData = "data" in interactionField;

  if (filterSelected && filterHasData){
    // call the highlightBar function on the selected data
    highlightBar(interactionField.data);
  } else {
    // clear highlighting if no data selected
    clearHighlight()
  }
}
Constructing interactionData
The interactionData object defines how Looker Studio will filter your
dashboard.
Single dimension filter
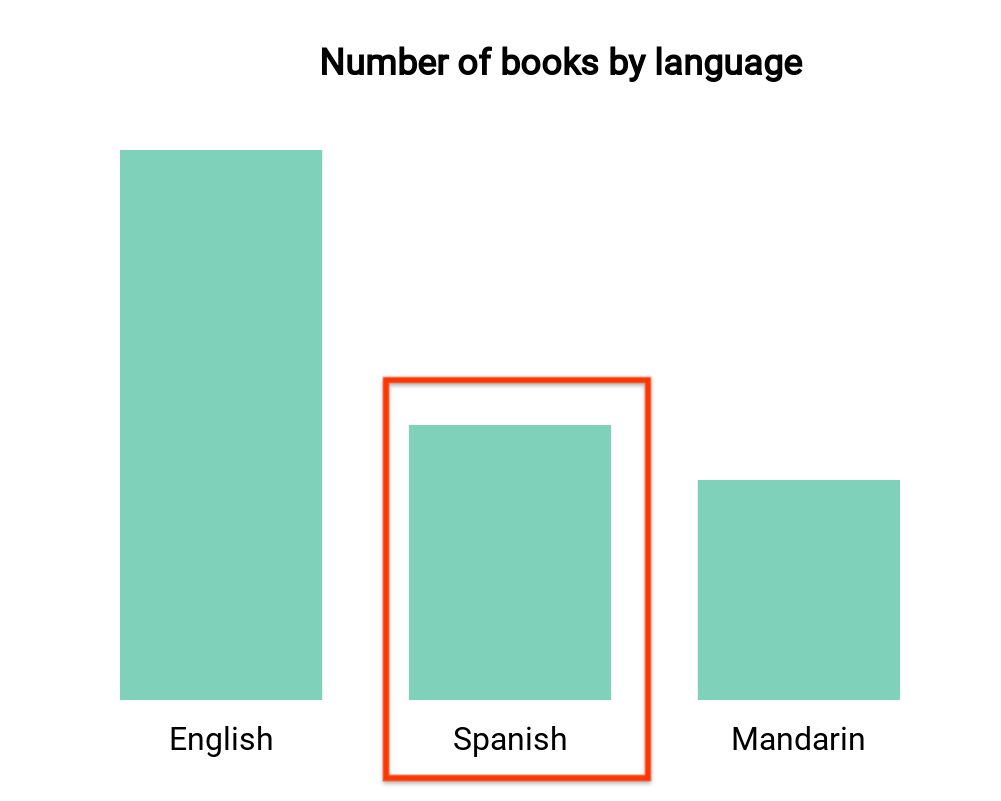
This bar chart visualizes number of books by language (one dimension and one
metric). Suppose a user selected the bar corresponding to books in Spanish, and
you wanted the selection to filter the rest of the dashboard. Your
interactionData would look like this:
var interactionData = {
  "concepts": ["languageDimensionId"],
  "values": [["Spanish"]]
}
Multiple dimension filter
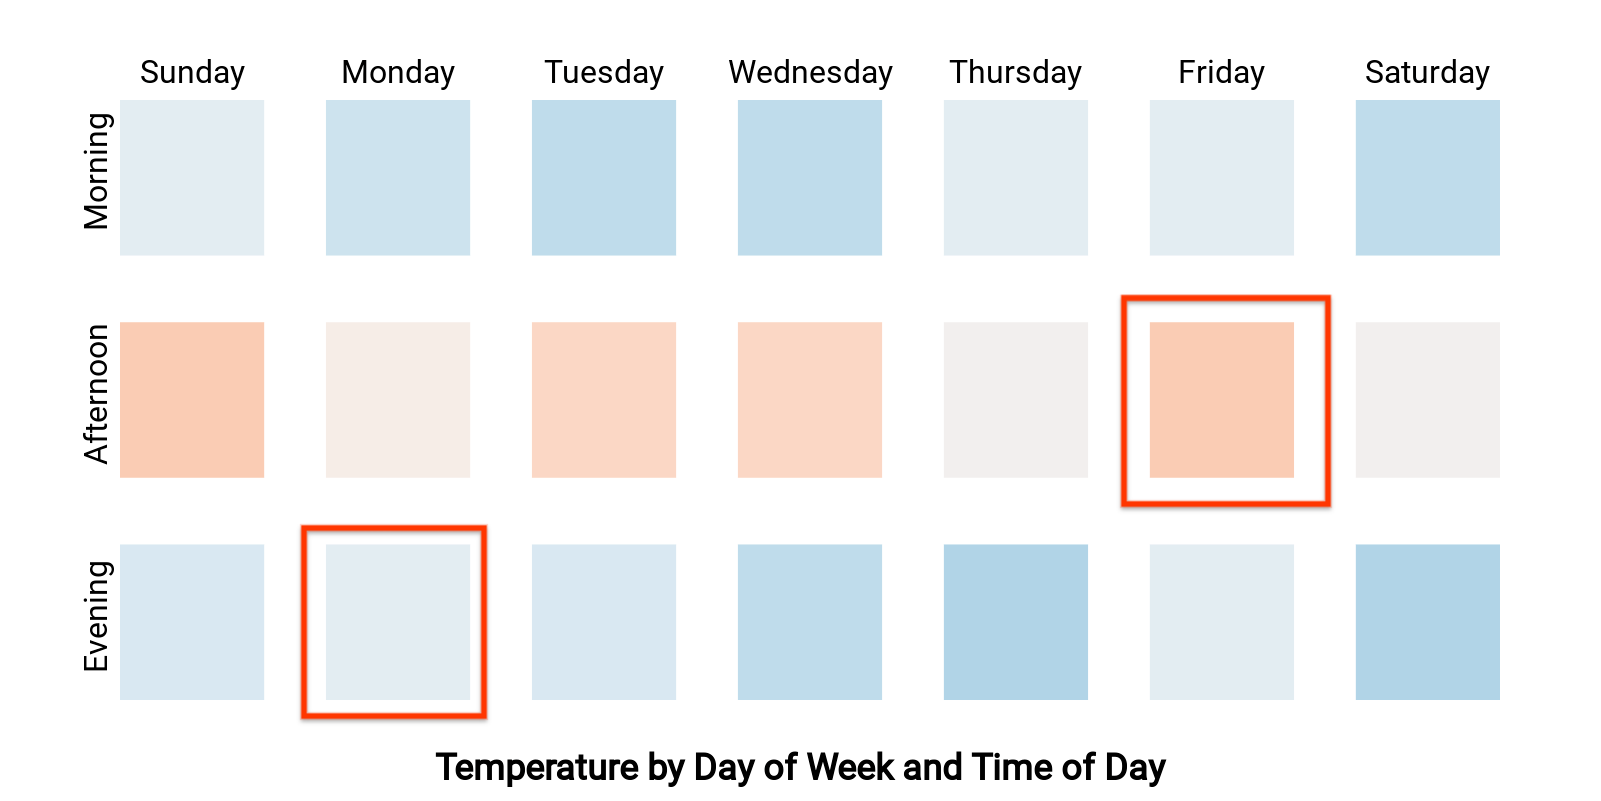
This heatmap shows temperature by day of week and time of day (two dimensions
and one metric). Suppose a user selected the cells corresponding to "Monday
evening" and "Friday afternoon", and you wanted to filter the rest of the
dashboard to only show data from either "Monday evening" or "Friday
afternoon".Your interactionData would look like this:
var interactionData = {
  "concepts": ["dayOfWeekDimensionId", "timeOfDayDimensionId"],
  "values": [
    ["Monday", "evening"],
    ["Friday", "afternoon"]
  ]
}