
This document describes how to create Venn diagrams using the Chart API.
Table of Contents
Chart-Specific Features
|
Standard Features
|
Introduction
Venn diagrams are charts with overlapping circles that indicate how much different groups have in common. Charts supports Venn diagrams with two or three circles. You specify the relative sizes of the circles and the amount of overlap between them.
Chart Types (cht)
Specify a Venn diagram with the following syntax:
Syntax
cht=v
The data string is a set of up to seven elements, separated by the delimiter appropriate for your data format, as described here:
- The first three values specify the sizes of three circles: A, B, and C. For a chart with only two circles, specify zero for the third value.
- The fourth value specifies the size of the intersection of A and B.
- The fifth value specifies the size of the intersection of A and C. For a chart with only two circles, do not specify a value here.
- The sixth value specifies the size of the intersection of B and C. For a chart with only two circles, do not specify a value here.
- The seventh value specifies the size of the common intersection of A, B, and C. For a chart with only two circles, do not specify a value here.
Note that with Venn diagrams, all values are proportionate, not absolute. This means that a chart with values 10,20,30 will look the same as a chart with values 100,200,300 (if your encoding type accepts those values).
| Description | Example |
|---|---|
A three-circle Venn chart. |
|
| To specify a two-circle chart, specify zero for circle C, and do not specify any overlap values that include C. |  cht=v |

Series Colors chco
You can specify the colors of all series, each series, or some series using the chco parameter.
Syntax
chco=<color_1>,...,<color_n>
- <color>
- Color of the series, in RRGGBB hexadecimal format. Specify different colors for different series by adding color values separated by a comma. If you have fewer colors than you have series, the last color is repeated, but in Venn charts, identical colors can make the chart hard to read.
| Description | Example |
|---|---|
| A different color for each circle. |  chco=FF6342,ADDE63,63C6DE |
| If there are fewer colors than circles, the last color specified is repeated. However, this makes the chart hard to read. |
|

Standard Features
The rest of the features on this page are standard chart features.
Specify colors using a 6-character string of hexadecimal values, plus two optional
transparency values, in the format RRGGBB[AA].
For example:
FF0000= Red00FF00= Green0000FF= Blue000000= BlackFFFFFF= White
AA is an optional transparency value, where 00 is
completely transparent and FF is completely opaque. For example:
0000FFFF= Solid blue0000FF66= Transparent blue
Chart Title chtt, chts [All
charts]
You can specify the title text, color, and font size for your chart.
Syntax
chtt=<chart_title>
chts=<color>,<font_size>,<opt_alignment>
chtt - Specifies the chart title.
- <chart_title>
- Title to show for the chart. You cannot specify where this appears, but you
can optionally specify the font size and color. Use a + sign to indicate spaces,
and a pipe character (
|) to indicate line breaks.
chts [Optional] - Colors and font
size for the chtt parameter.
- <color>
- The title color, in RRGGBB hexadecimal format. Default color is black.
- <font_size>
- Font size of the title, in points.
- <opt_alignment>
- [Optional] Alignment of the title. Choose one of the following case-sensitive string values: "l" (left), "c" (centered) "r" (right). Default is "c".
Examples
| Description | Example |
|---|---|
A chart with a title, using default color and font size. Specify a space with a plus sign ( Use a pipe character (
|
 chtt=Site+visitors+by+month| |
A chart with a blue, right-aligned, 20-point title. |
 chtt=Site+visitors |
Chart Legend Text and Style chdl, chdlp, chdls [All
charts]
The legend is a side section of the chart that gives a small text description of each series. You can specify the text associated with each series in this legend, and specify where on the chart it should appear.
See also chma,
to learn how to set the margins around your legend.
A note on string
values: Only
URL-safe characters are permitted in label strings. To be safe, you should URL-encode
any strings containing characters not in the character set 0-9a-zA-Z.
You can find a URL encoder in the Google Visualization
Documentation.
Syntax
chdl=<data_series_1_label>|...|<data_series_n_label>
chdlp=<opt_position>|<opt_label_order>
chdls=<color>,<size>
chdl - The text for each series, to display in the
legend.
- <data_series_label>
- The text for the legend entries. Each label applies to the corresponding series
in the
chdarray. Use a + mark for a space. If you do not specify this parameter, the chart will not get a legend. There is no way to specify a line break in a label. The legend will typically expand to hold your legend text, and the chart area will shrink to accommodate the legend.
chdlp - [Optional] The position of
the legend, and order of the legend entries. You can specify <position>
and/or <label_order>. If you specify both, separate them with a bar
character. You can add an 's' to any value if you want empty legend entries in
chdl to be skipped in the legend. Examples: chdlp=bv, chdlp=r, chdlp=bv|r, chdlp=bvs|r
- <opt_position>
- [Optional] Specifies the position of the legend on the chart. To specify additional
padding between the legend and the chart area or the image border, use the
chmaparameter. Choose one of the following values:b- Legend at the bottom of the chart, legend entries in a horizontal row.bv- Legend at the bottom of the chart, legend entries in a vertical column.t- Legend at the top of the chart, legend entries in a horizontal row.tv- Legend at the top of the chart, legend entries in a vertical column.r- [Default] Legend to the right of the chart, legend entries in a vertical column.l- Legend to the left of the chart, legend entries in a vertical column.
- <opt_label_order>
- [Optional]
The order in which the labels are shown in the legend.
Choose one of the following value:
l- [Default for vertical legends] Display labels in the order given tochdl.r- Display labels in the reverse order as given tochdl. This is useful in stacked bar charts to show the legend
in the same order as the bars appear.a- [Default for horizontal legends] Automatic ordering: roughly means sorting by length, shortest first, as measured in 10 pixel blocks. When two elements are the same length (divided into 10 pixel blocks), the one listed first will appear first.0,1,2...- Custom label order. This is a list of zero-based label indexes fromchdl, separated by commas.
chdls - [Optional] Specifies the color and font size of the legend text.
- <color>
- The legend text color, in RRGGBB hexadecimal format.
- <size>
- The point size of the legend text.
Examples
| Description | Example |
|---|---|
Two examples of legends. Specify legend text in the same order as your data series. |
chdl=NASDAQ|FTSE100|DOW
chdl=First|Second|Third |
The first chart demonstrates horizontal legend entries ( |
|
| This example demonstrates changing the font size. |
|


Chart Margins chma [All
charts]
You can specify the size of the chart's margins, in pixels. Margins are calculated
inward from the specified chart size (chs); increasing the margin
size does not increase the total chart size, but rather shrinks the chart area,
if necessary.
The margins are by default whatever is left over after the chart size is calculated. This default value varies by chart type. The margins that you specify are a minimum value; if the chart area leaves room for margins, the margin size will be whatever is left over; you cannot squeeze the margins smaller than what is required for any legends and labels. Here's a diagram showing the basic parts of a chart:
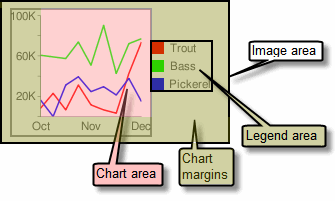 |
The chart margins include the axis labels and the legend
area. The legend
area resizes automatically to fit the text exactly, unless you specify a larger
width using Tip: In a bar chart, if the bars have a fixed size (the default), the chart
area width cannot be reduced. You must specify a smaller or resizeable bar
size using |
Syntax
chma=
  <left_margin>,<right_margin>,<top_margin>,<bottom_margin>|<opt_legend_width>,<opt_legend_height>
- <left_margin>, <right_margin>, <top_margin>, <bottom_margin>
- Minimum margin size around the chart area, in pixels. Increase this value to include some padding to prevent axis labels from bumping against the borders of the chart.
- <opt_legend_width>, <opt_legend_height>
- [Optional] Width of the margin around the legend, in pixels. Use this to avoid having the legend bump up against the chart area or the edges of the image.
Examples
| Description | Example |
|---|---|
In this example, the chart has a minimum margin of 30 pixels on each side. Because the chart legend is more than 30 pixels wide, the margin on the right side is set to the width of the chart legend, and is different from the other margins. Axis labels are outside the plot area, and are therefore drawn within the margin space. |
|
To add a margin around the legend, set a value for the In this example, the legend is approximately 60 pixels wide. If you set
the the |
|


Background Fills chf [All
charts]
You can specify fill colors and styles for the chart data area and/or the whole
chart background. Fill types include solid fills, striped fills, and gradients.
You can specify different fills for different areas (for example, the whole chart
area, or just the data area). The chart area fill
overwrites the background fill. All fills are specified using the chf parameter,
and you can mix different fill types (solids, stripes, gradients) in the same chart
by separating values with pipe character ( | ). Chart area fills overwrite chart
background fills.
Solid Fills chf [All
Charts]
You can specify a solid fill for the background and/or chart area, or assign a
transparency value to the whole chart. You can specify multiple fills using the
pipe character (|). (Maps: background only).
Syntax
chf=<fill_type>,s,<color>|...
- <fill_type>
- The part of the chart being filled. Specify one of the following values:
bg- Background fillc- Chart area fill. Not supported for map charts.a- Make the whole chart (including backgrounds) transparent. The first six digits of<color>are ignored, and only the last two (the transparency value) are applied to the whole chart and all fills.b<index>- Bar solid fills (bar charts only). Replace <index> with the series index of the bars to fill with a solid color. The effect is similar to specifyingchcoin a bar chart. See Bar Chart Series Colors for an example.
- s
- Indicates a solid or transparency fill.
- <color>
- The fill color, in RRGGBB hexadecimal format. For transparencies, the first six digits are ignored, but must be included anyway.
Examples
| Description | Example |
|---|---|
This example fills the chart background with pale gray
( |
|
This example fills the chart background with pale gray
( |
|
| This example applies a 50% transparency to the whole chart (80 in hexadecimal is 128, or about 50% transparency). Notice the table cell background showing through the chart. |
|


Gradient Fills chf [Line,
Bar, Google-o-meter, Radar, Scatter,Venn]
You can apply one or more gradient fills to chart areas or backgrounds. Gradient fills are fades from a one color to another color. (Pie, Google-o-meter charts: background only.)
Each gradient fill specifies an angle, and then two or more colors anchored to a specified location. The color varies as it moves from one anchor to another. You must have at least two colors with different <color_centerpoint> values, so that one can fade into the other. Each additional gradient is specified by a <color>,<color_centerpoint> pair.
Syntax
chf=<fill_type>,lg,<angle>,<color_1>,<color_centerpoint_1>
    ,...,
  <color_n>,<color_centerpoint_n>
- <fill_type>
- The chart area to fill. One of the following:
bg- Background fillc- Chart area fill.b<index>- Bar gradient fills (bar charts only). Replace <index> with the series index of the bars to fill with a gradient. See Bar Chart Series Colors for an example.
- lg
- Specifies a gradient fill.
- <angle>
- A number specifying the angle of the gradient from 0 (horizontal) to 90 (vertical).
- <color>
- The color of the fill, in RRGGBB hexadecimal format.
- <color_centerpoint>
- Specifies the anchor point for the color. The color will start to fade from this point as it approaches another anchor. The value range is from 0.0 (bottom or left edge) to 1.0 (top or right edge), tilted at the angle specified by <angle>.
Examples
| Description | Example |
|---|---|
Chart area has a horizontal linear gradient, specified
with an angle of zero degrees ( The colors are peach ( The chart background is drawn in gray ( |
|
Chart area has a diagonal (bottom left to top right) linear
gradient, specified with an angle of forty-five degrees ( Peach ( Blue ( The chart background is drawn in gray ( |
|
Chart area has a vertical (top to bottom) linear gradient,
specified with an angle of ninety degrees ( Blue ( Peach ( The chart background is drawn in gray ( |
|


Striped fills chf [Line,
Bar, Google-o-meter, Radar, Scatter, Venn]
You can specify a striped background fill for your chart area, or the whole chart. (Pie, Google-o-meter charts: background only.)
Syntax
chf=
  <fill_type>,ls,<angle>,<color_1>,<width_1>
    ,...,
  <color_n>,<width_n>
- <fill_type>
- The chart area to fill. One of the following:
bg- Background fillc- Chart area fillb<index>- Bar striped fills (bar charts only). Replace <index> with the series index of the bars to fill with stripes. See Bar Chart Series Colors for an example.
- ls
- Specifies linear stripe fill.
- <angle>
- The angle of all stripes, relative to the y-axis. Use
0for vertical stripes or90for horizontal stripes. - <color>
- The color for this stripe, in RRGGBB hexadecimal format. Repeat <color> and <width> for each additional stripe. You must have at least two stripes. Stripes alternate until the chart is filled.
- <width>
- The width of this stripe, from
0to1, where1is the full width of the chart. Stripes are repeated until the chart is filled. Repeat <color> and <width> for each additional stripe. You must have at least two stripes. Stripes alternate until the chart is filled.
Examples
| Description | Example |
|---|---|
|
 chf= |
|
 chf= |